Function
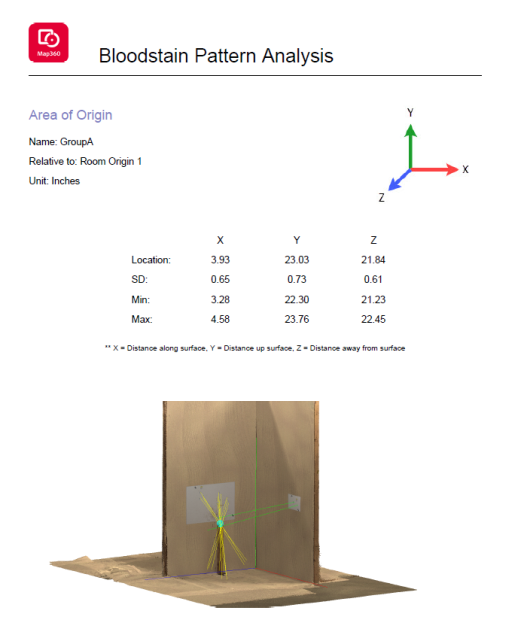
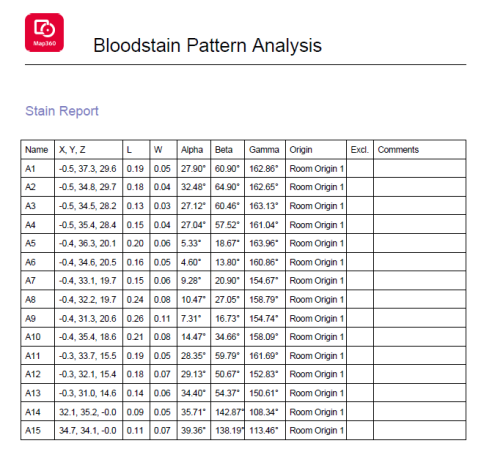
The area of origin can be visualized in both 2D and 3D and a report can be created with the calculated results. The BPA report provides the location of the area of origin and standard deviation.A stain report can be included providing information on the stains selected for the convergence. Any excluded stains and comments will also be displayed on the report.
Procedure
Adjust the view of the scene before selecting the BPA Report button. A screenshot of the drawing area will be captured for the BPA report.
-
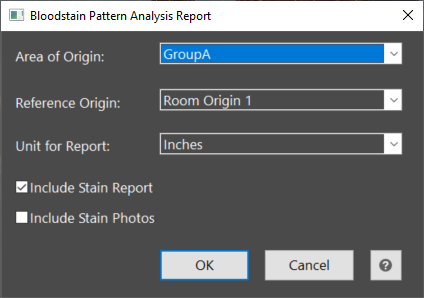
The user will first choose the Area of Origin for the report. Only one Area of Origin can be reported at a time. If more than one Area of Origin exists in the scene, the user will pick one from the drop down on the report dialog.
-
The Area of Origin location is measured from the reference origin. If more than one origin exists in the scene, the user will pick one from the drop down on the report dialog.
-
The results will be reported in either inches or centimeters. The user can choose which units to display.
-
A stain report can also be included providing the location of each stain with its length and width, angles from the surface, and reference origin. If a stain was excluded from analysis it will be indicated on the report along with the comments.
-
Select Ok to save the report as a PDF. The report will open automatically.
An image for the chosen coordinate system is displayed at the top as a reference for the results. The results are provided for the XYZ distances from the room origin to the Area of Origin along with their standard deviations. The Min and Max values are given as the location +/- 1 SD.