
New features
See which projects are driving your usage
If you run several projects under one subscription, you can now pull a single report showing how much each project contributed to your upload, download, and processing volume — and which users inside each project did the work. Pick any month, quarter, or custom window up to three months.
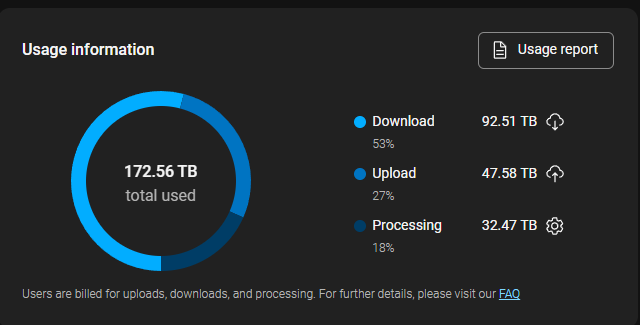
That makes per-project cost attribution practical: bill usage back to the right project, and see at a glance where your subscription is being consumed.
Admins generate the report from the Subscriptions page. Pick a date range and Hexagon GeoCloud builds the CSV for you. The file has a row per user, project, activity type, and day, and opens directly in Excel.
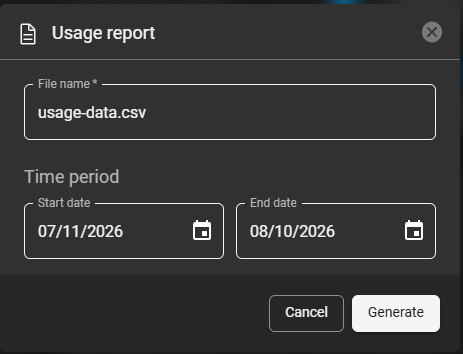
Stay on the Subscriptions page while your report is being generated — the download link appears there once it's ready. If you navigate away before then, you'll need to generate the report again.
-
Available to platform admins and account admins.
-
Choose any range from one day up to three months, looking back up to a year.
-
Reports can't cover dates from before this feature went live.
-
Some rows may not show project information.
-
Each report is generated fresh, and the download link is temporary — save the file once it's ready.
For the full steps, see Export a usage report per project in the documentation.
Improvements
-
GeoTag thumbnails match the view you save - A GeoTag's thumbnail and camera position are now captured when you click Save, instead of when you place the last point, so the thumbnail shows the view you actually saved. This matches how Measurements already behave.
Bug fixes
-
Editing a new list category opens the right category - Previously, editing a newly created list category could open a sibling text category in the editor instead. The category you pick now opens.
-
Sharing links keep working - Previously, some sharing links stopped working soon after they were created, so recipients couldn't open the shared asset. Sharing links now work as expected.
Related articles
-
Export a usage report per project — step-by-step guide to generating the CSV
-
Interpreting the Dashboard — how to read the subscription plan and usage information panels
-
Usage-based Account Information — what counts towards your data allowance
-
Roles and permissions — which roles can view and export usage