Types of measurements
There is 3 types of objects for measurements in Cyclone 3DR :
-
Measures: They can be created by multiple commands that cover a wide range of measurements. Measures can also be created with Pick Info and Pick Analysis in the Measurement Toolbar. Measures are permanent and highly customizable. These measures are used for the report.
-
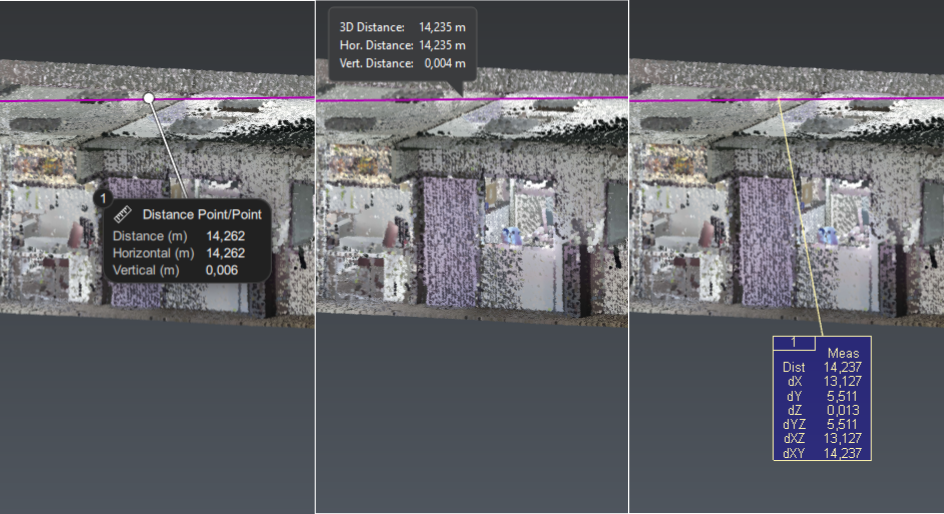
Quick measures: They are created through the Measurement Toolbar and are used to measure distances and angles. Quick measures are temporary and will disappear once you quit the command.
-
Labels: They are the legacy measurement objects and are deprecated. They can still be opened and edited in Cyclone 3DR but will be phased out in the future.
Create measures
|
Information needed |
Commands to use |
|---|---|
|
The coordinates or properties of an object |
|
|
Analysis values |
|
|
A distance between two objects |
Measures: Quick Measures: |
|
An angle |
Measures: Quick measures: |
|
A volume |
|
|
Advanced volume computation |
|
|
A surface area |
|
|
Geometrical comparison |
Measures from analysis
When creating analysis with commands like Compare inspect or Surface Levelness, a gradient is created to represent the results. With Pick Analysis, it is then possible to create measures linked to this gradient.
These measures have their background color as well as their tolerance values (Tol- and Tol+) determined by the parameters of the gradient. So if the parameters of the gradient are changed with Edit Colors, the measures will be updated as well.
Once the tolerances of a measure have been modified with Edit Tolerances, they are no longer linked with the gradient and won’t be updated when the gradient is changed with Edit Colors. It doesn’t affect the background color which will still be updated.
Measure templates and customization
Information in the measures are displayed according to their template. A measure template is a list of parameters that can be displayed or not, specific to each type of measure.
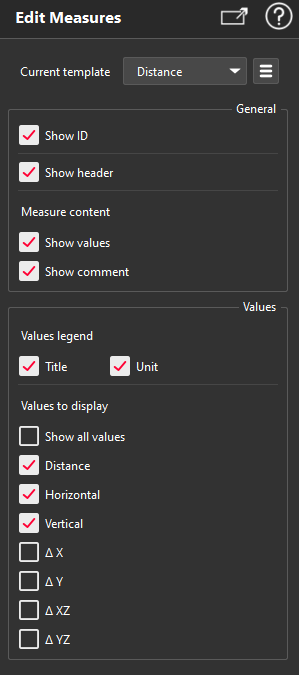
The default information displayed are based on the default templates that can be modified in the settings and are only applied to new projects. Modifying them won’t affect existing measures.
-
To change a measure template in the current project, use Edit Measures. All the measures using this template will be updated.
-
To change the minimum tolerance (Tol-) and the maximum tolerance (Tol+) of the selected measures, use Edit Tolerances.
-
To add or modify a comment of the selected measures, use Edit Comment.
It is also possible to modify existing measures or create custom ones using script functions.
Sharing measures templates
To be able to easily share the same templates parameters it is possible to export and import them. They are exported as HLT files that can then be shared and imported in another Cyclone 3DR.
-
To import and export the default templates, use the advanced options of Default Templates in the Settings.
-
To import and export the templates currently used in the project, use the advanced options in Edit Measures.
A single HLT file can contain parameters for multiple templates. For both, default templates and current templates, there is an option to export all of them as a single file.
Positioning measures
There is two modes for positioning measures in the scene: Fixed Positioning and Screen Border Positioning. The mode can be switched in the Settings or in the Contextual Menu.
-
Fixed Positioning: In this mode, measures are positioned at a set distancefrom their anchor point. They can be selected with left click and then moved in the scene by dragging them. If a measure is rendered transparent because of the movement of another measure, it’s anchor point remains visible and can still be selected.
-
Screen Border Positioning: In this mode, measures automatically positioned themselves on the border of screen. They can be selected but they can’t be moved.
Measures for reporting
Most commands that generate report data don’t automatically creates measures. So it is necessary to create measures (mostly with Pick Analysis) to generate data that can then appear in data tables. For more information on how to create reports, go to the Reporting section.
Practice
See exercise Make simple measurements in the Beginners Guide.