Show only the mesh called “Tank Mesh 1 Shell”. Select it and launch Create Color Map.
This command computes the deviations from the shell compared to the best cylinder. The deviations are displayed thanks to colors applied to the mesh.
The only input parameter required is a distance used to remove too distant points from the computation. By default, this value is initialized with the distance of the worst point used to compute the best cylinder, so that the result will be visually the same as the one that you had when computing the best cylinder.
Change this distance to 0.10 m in order to ignore the manhole and click Preview to replay the computation. We now see better where could be some problematic areas on the shell.
The color scale shows the maximum and the minimum distances as well as the distribution of the deviations between these two extreme values.
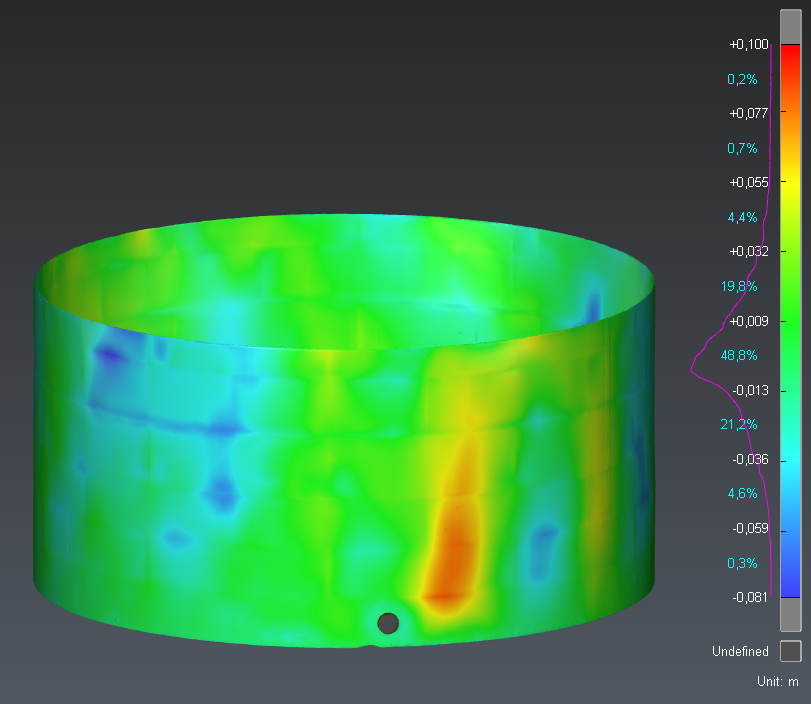
Compute the 3D deviations on the tank shell
Click OK to validate the result. Then, add measures on specific points on the shell using Pick Analysis. By default, the measures give the 3D deviation but you can add more info with Edit Measures.
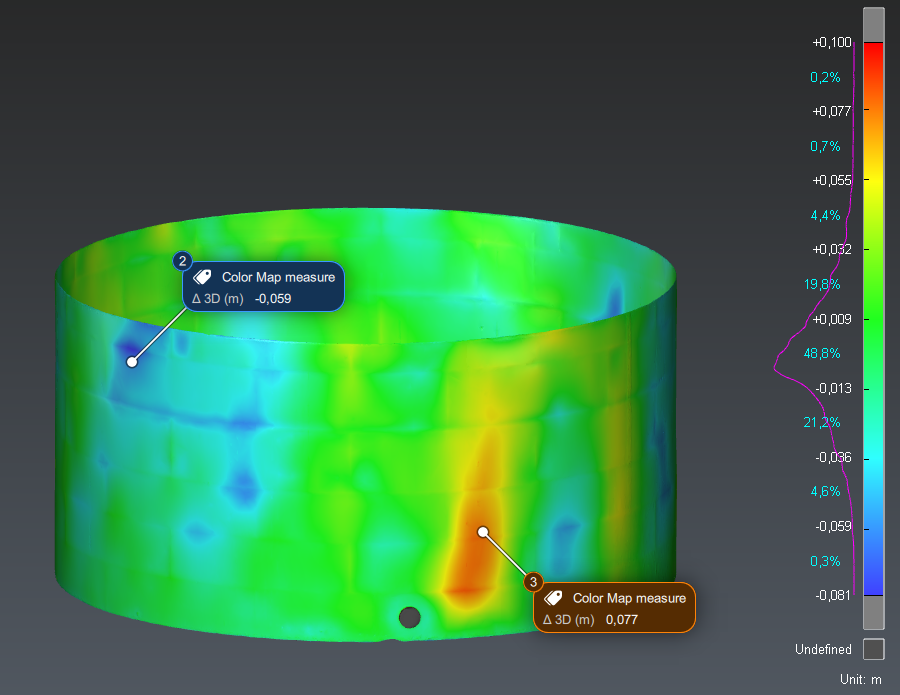
Create measures on specific points
The colored mesh and the measures are created in a new folder “Color Map”.