To assess the floor surface, straight lines are created at various locations.
Point elevations are then measured at regular 300 mm [12 in.] intervals along each line.
The elevation differences between all adjacent reading points are calculated, and a straight line approximation to the surface profile along each measurement line is produced and evaluated for consistency with visual observation of the floor surface.
The arithmetic differences between all adjacent 300 mm [12 in.] elevation differences are then calculated. Estimates of each test section’s floors FF Flatness and FL Levelness F-Numbers are obtained through statistical analyses of these calculated profile values.
A wizard-guided workflow supports users through their analysis.
The basic workflow is as follows:
-
Enter the plug-in from the left hand side plug-in menu.
-
Execute the 4 steps of the guided process as described below.
-
Export report in PDF document.
Note:
This feature is available to users with the Cyclone FIELD360 PRO license and also Cyclone 3DR AEC or PRO licenses.
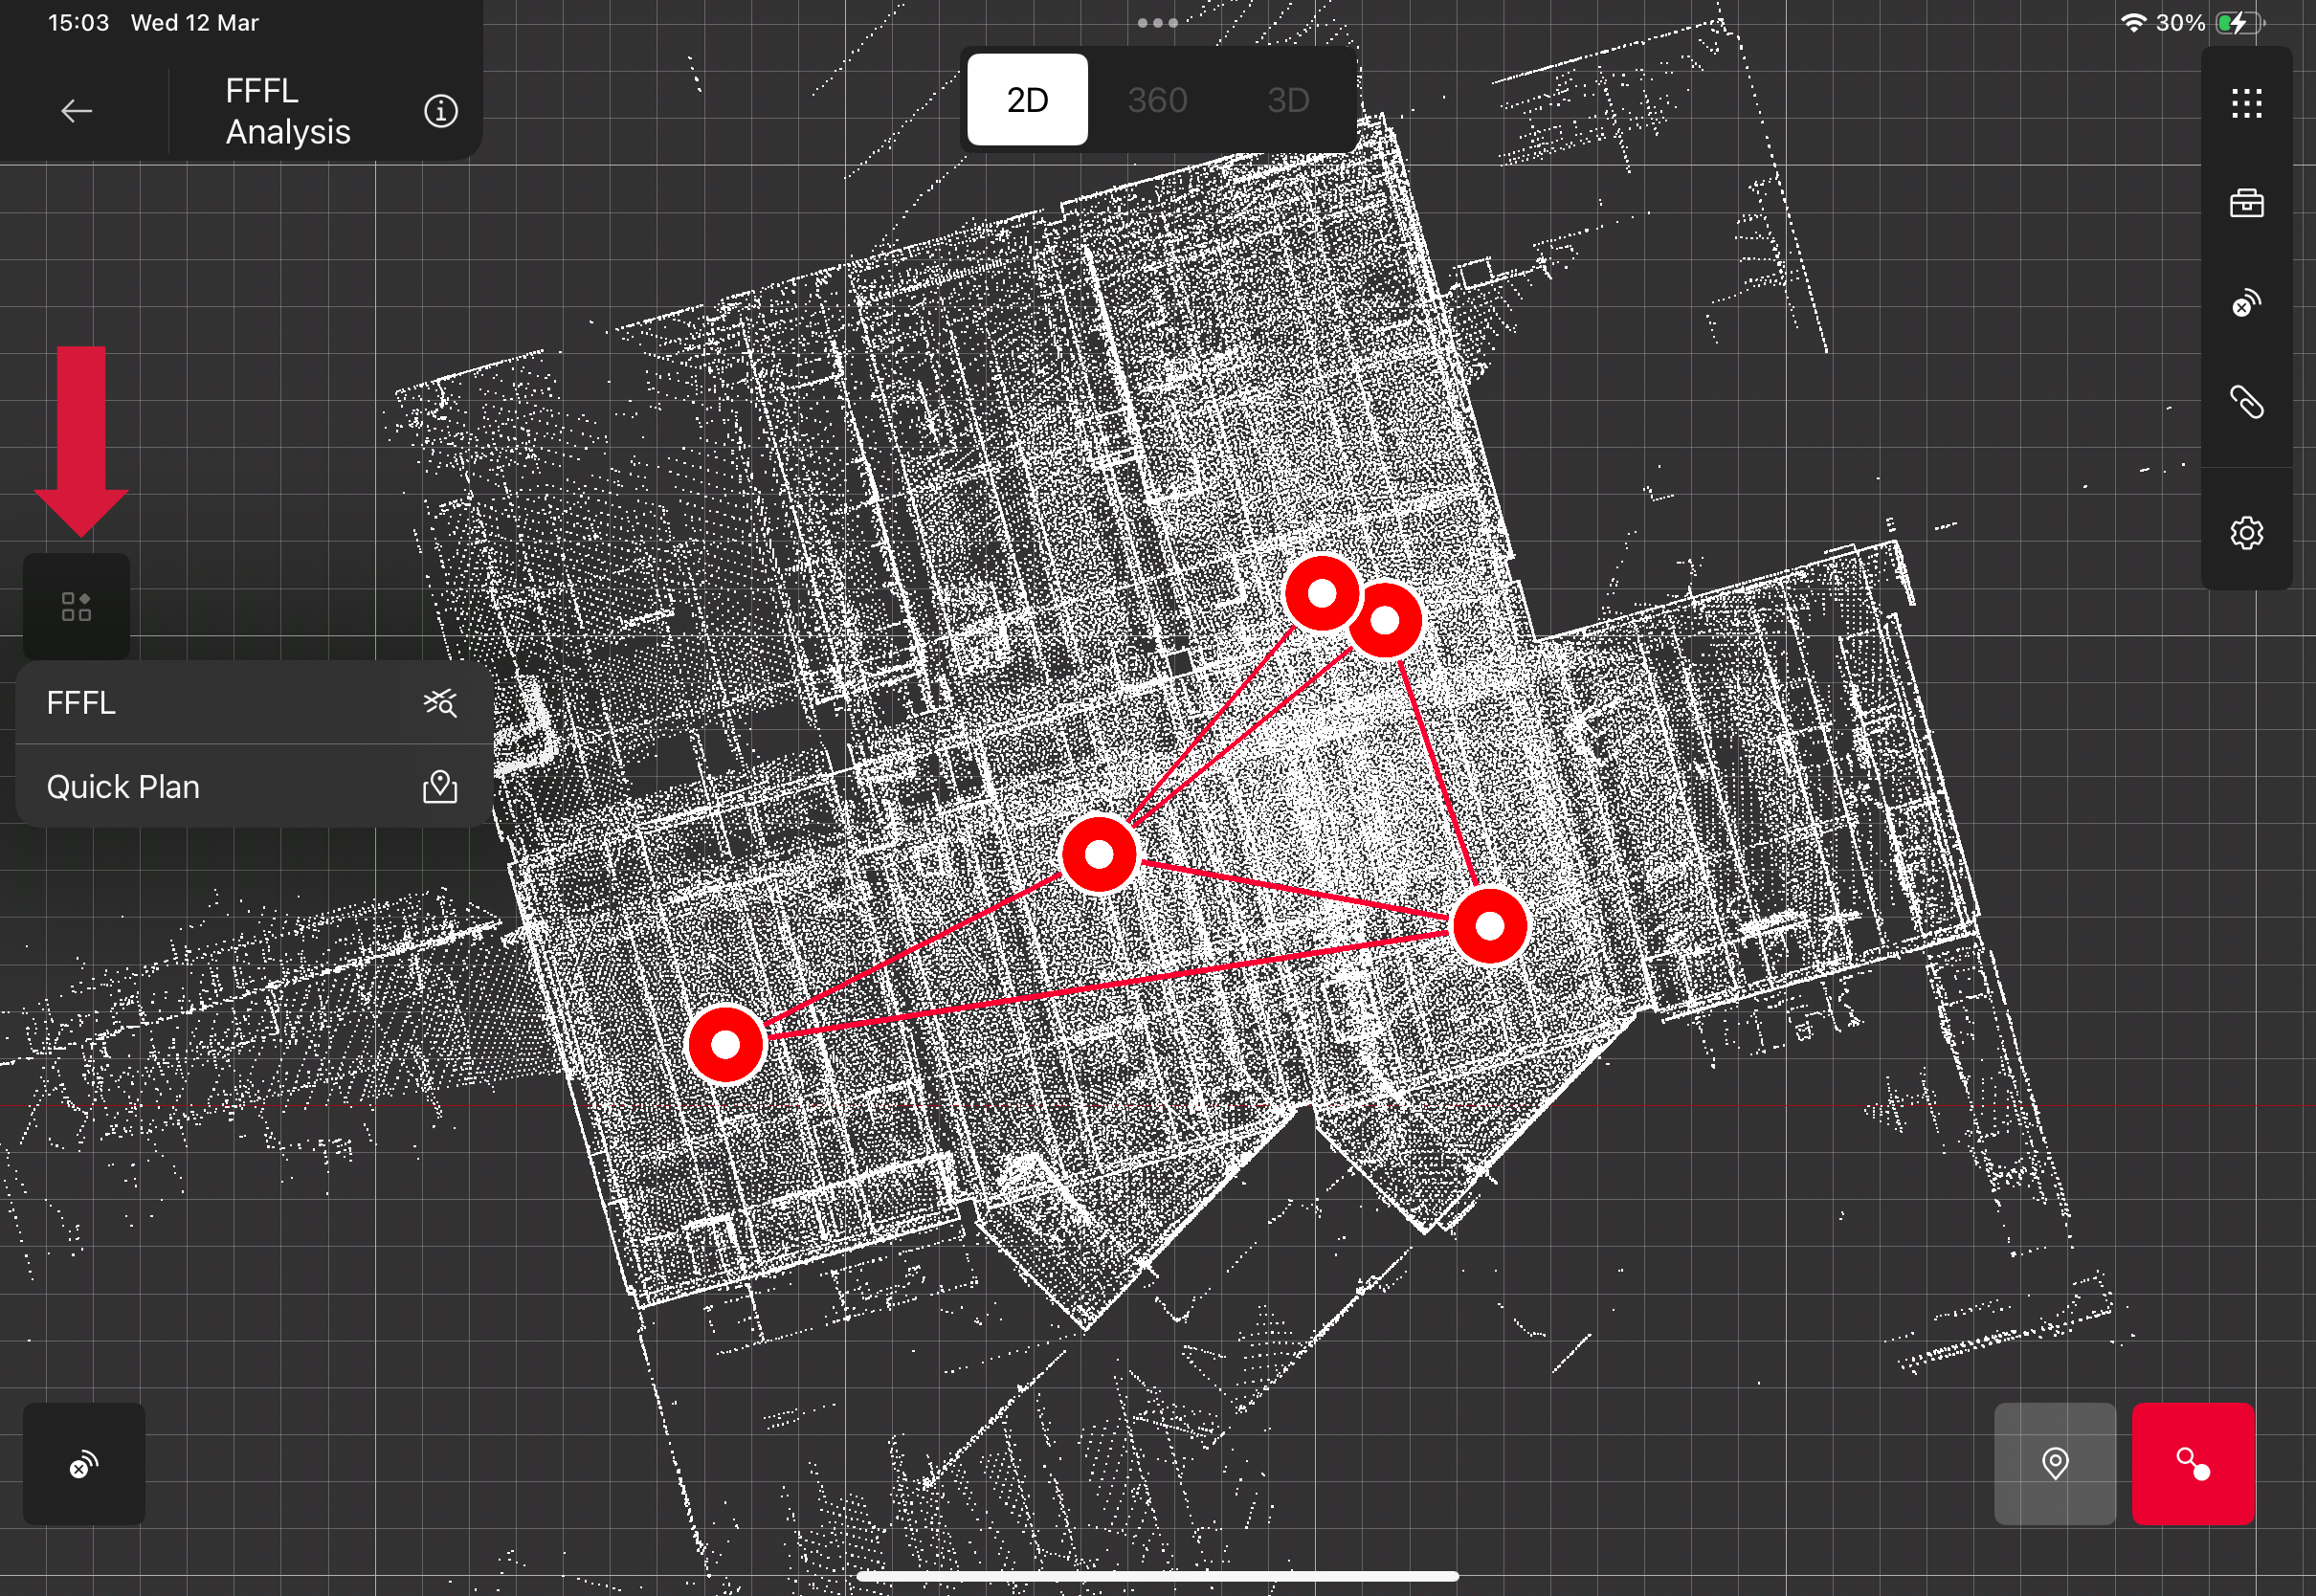
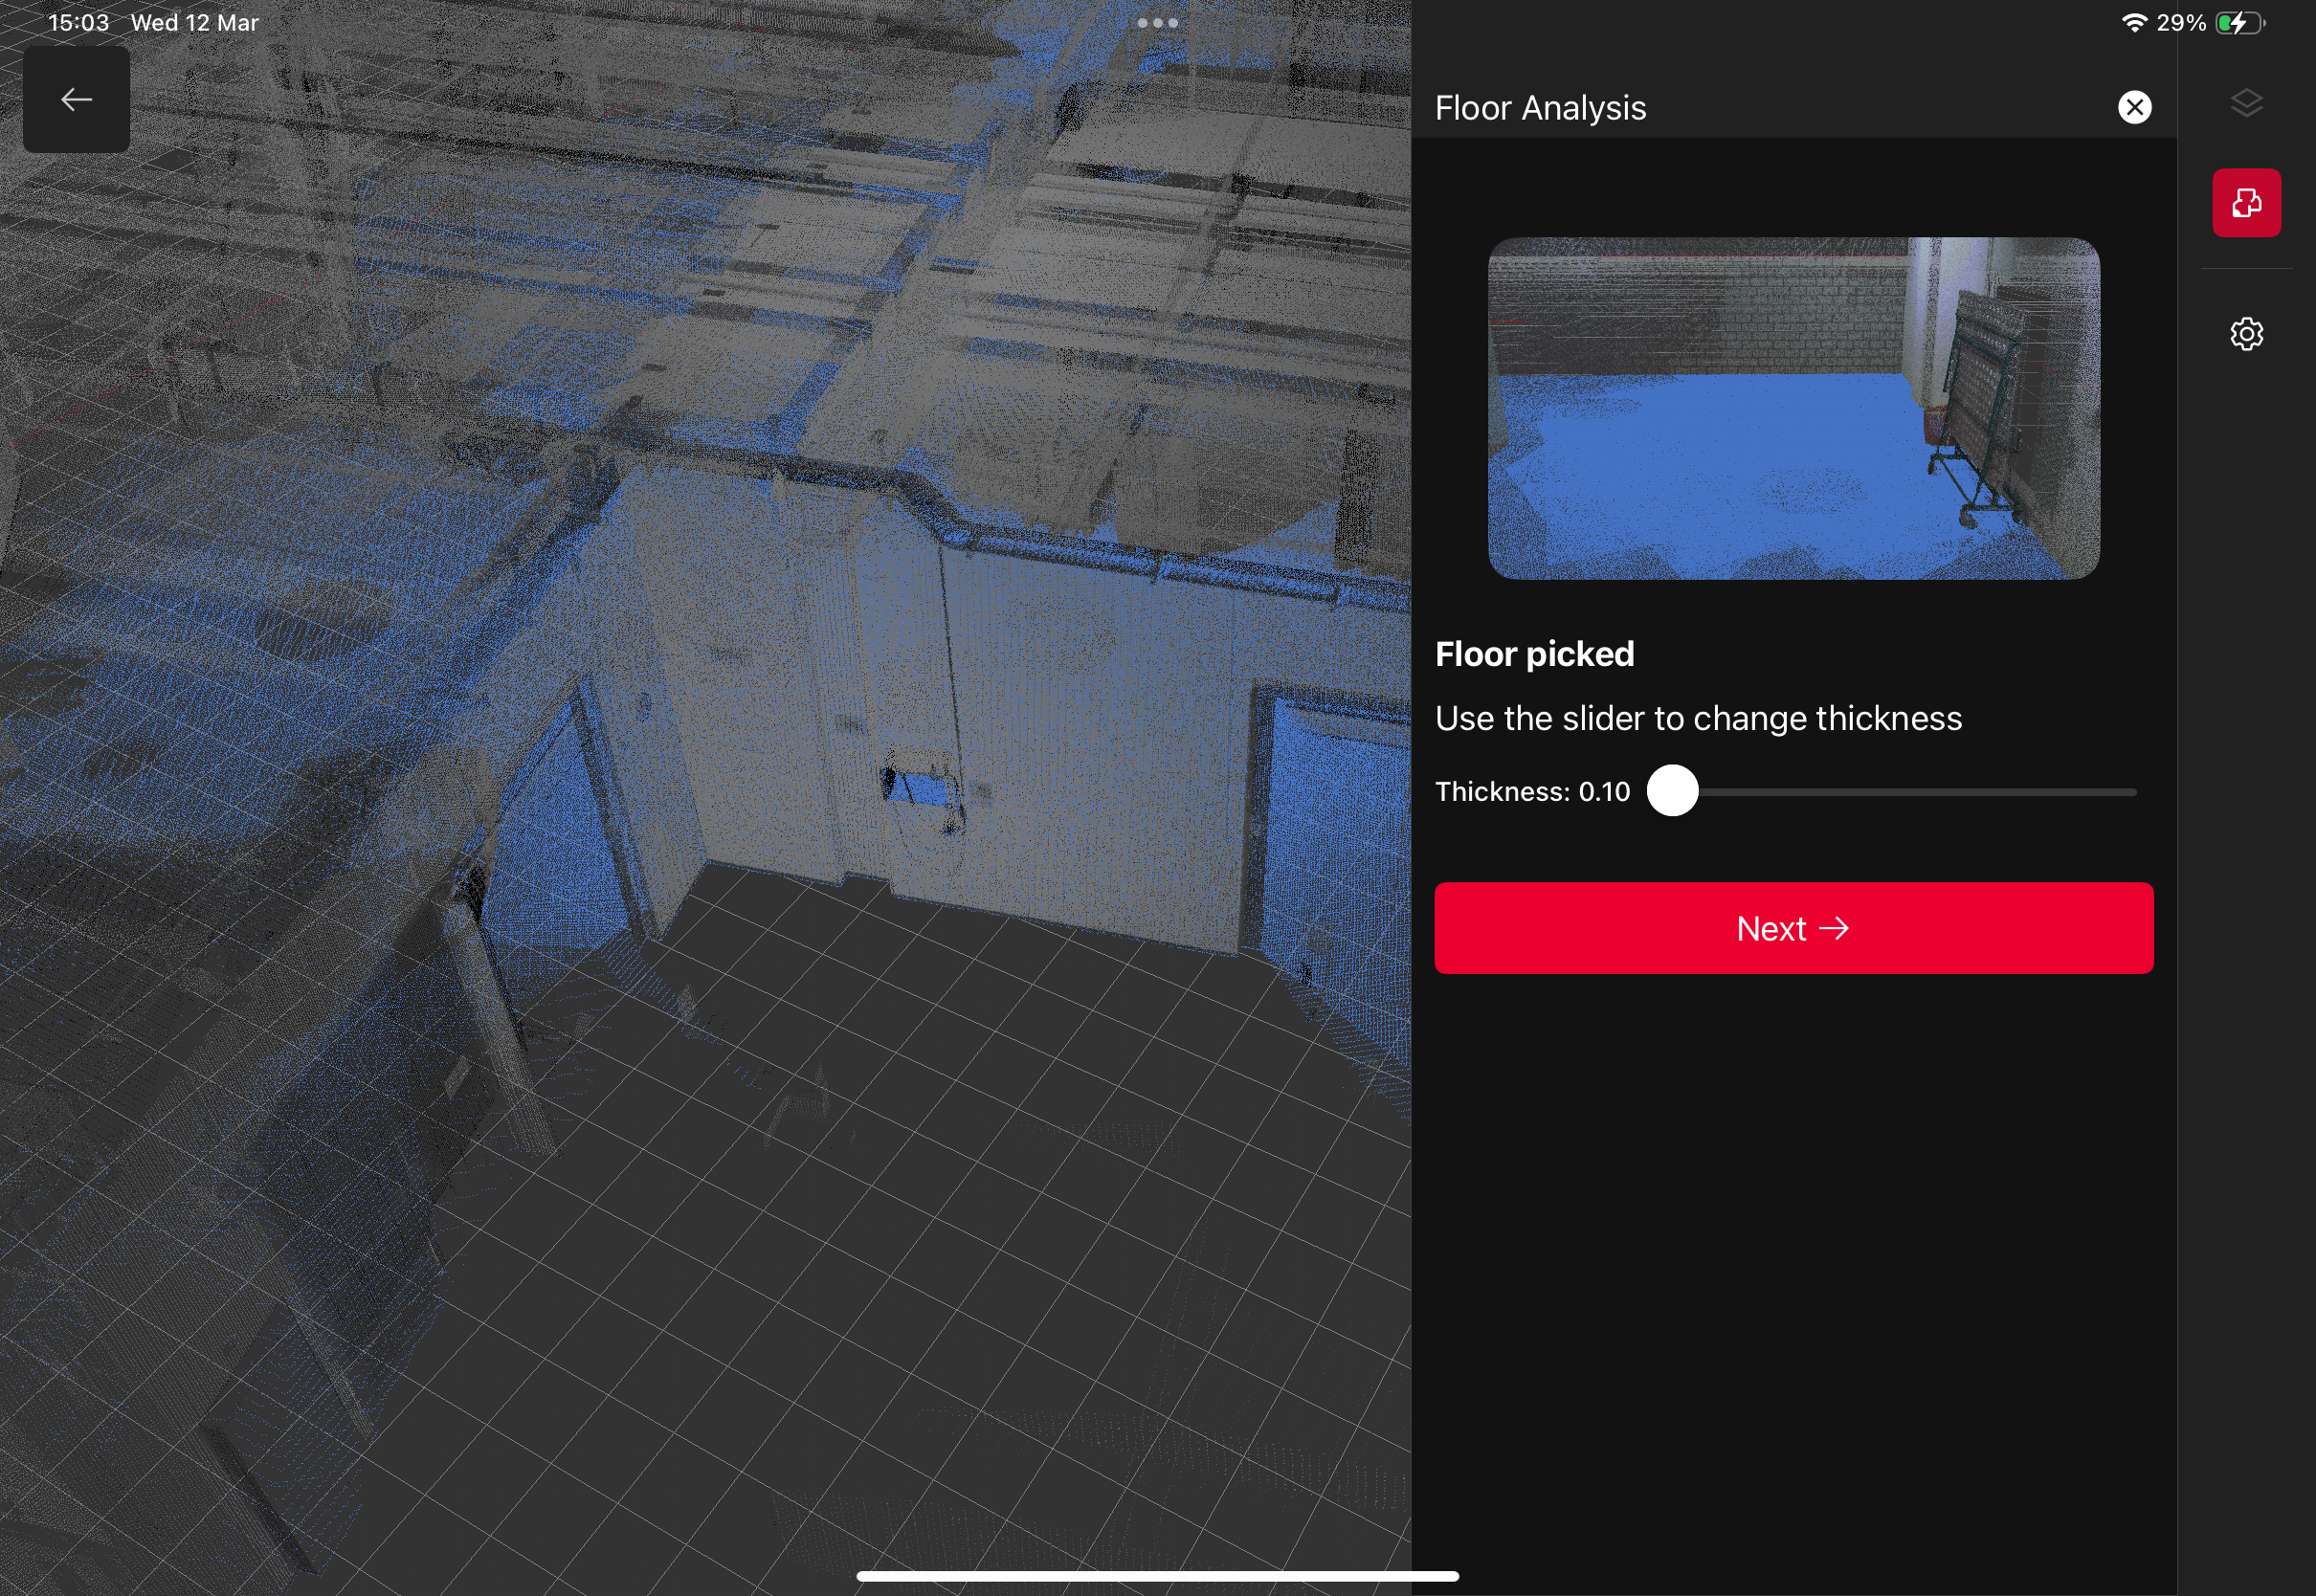
STEP 1 Extract Floor
-
Select scans or bundles for which you want to inspect the floor.
-
Point Cloud of the selected scan(s) will be displayed. Tap on the point cloud that represents the floor to extract and select an extraction threshold.
-
Press Next to proceed to the Define Test Section step.
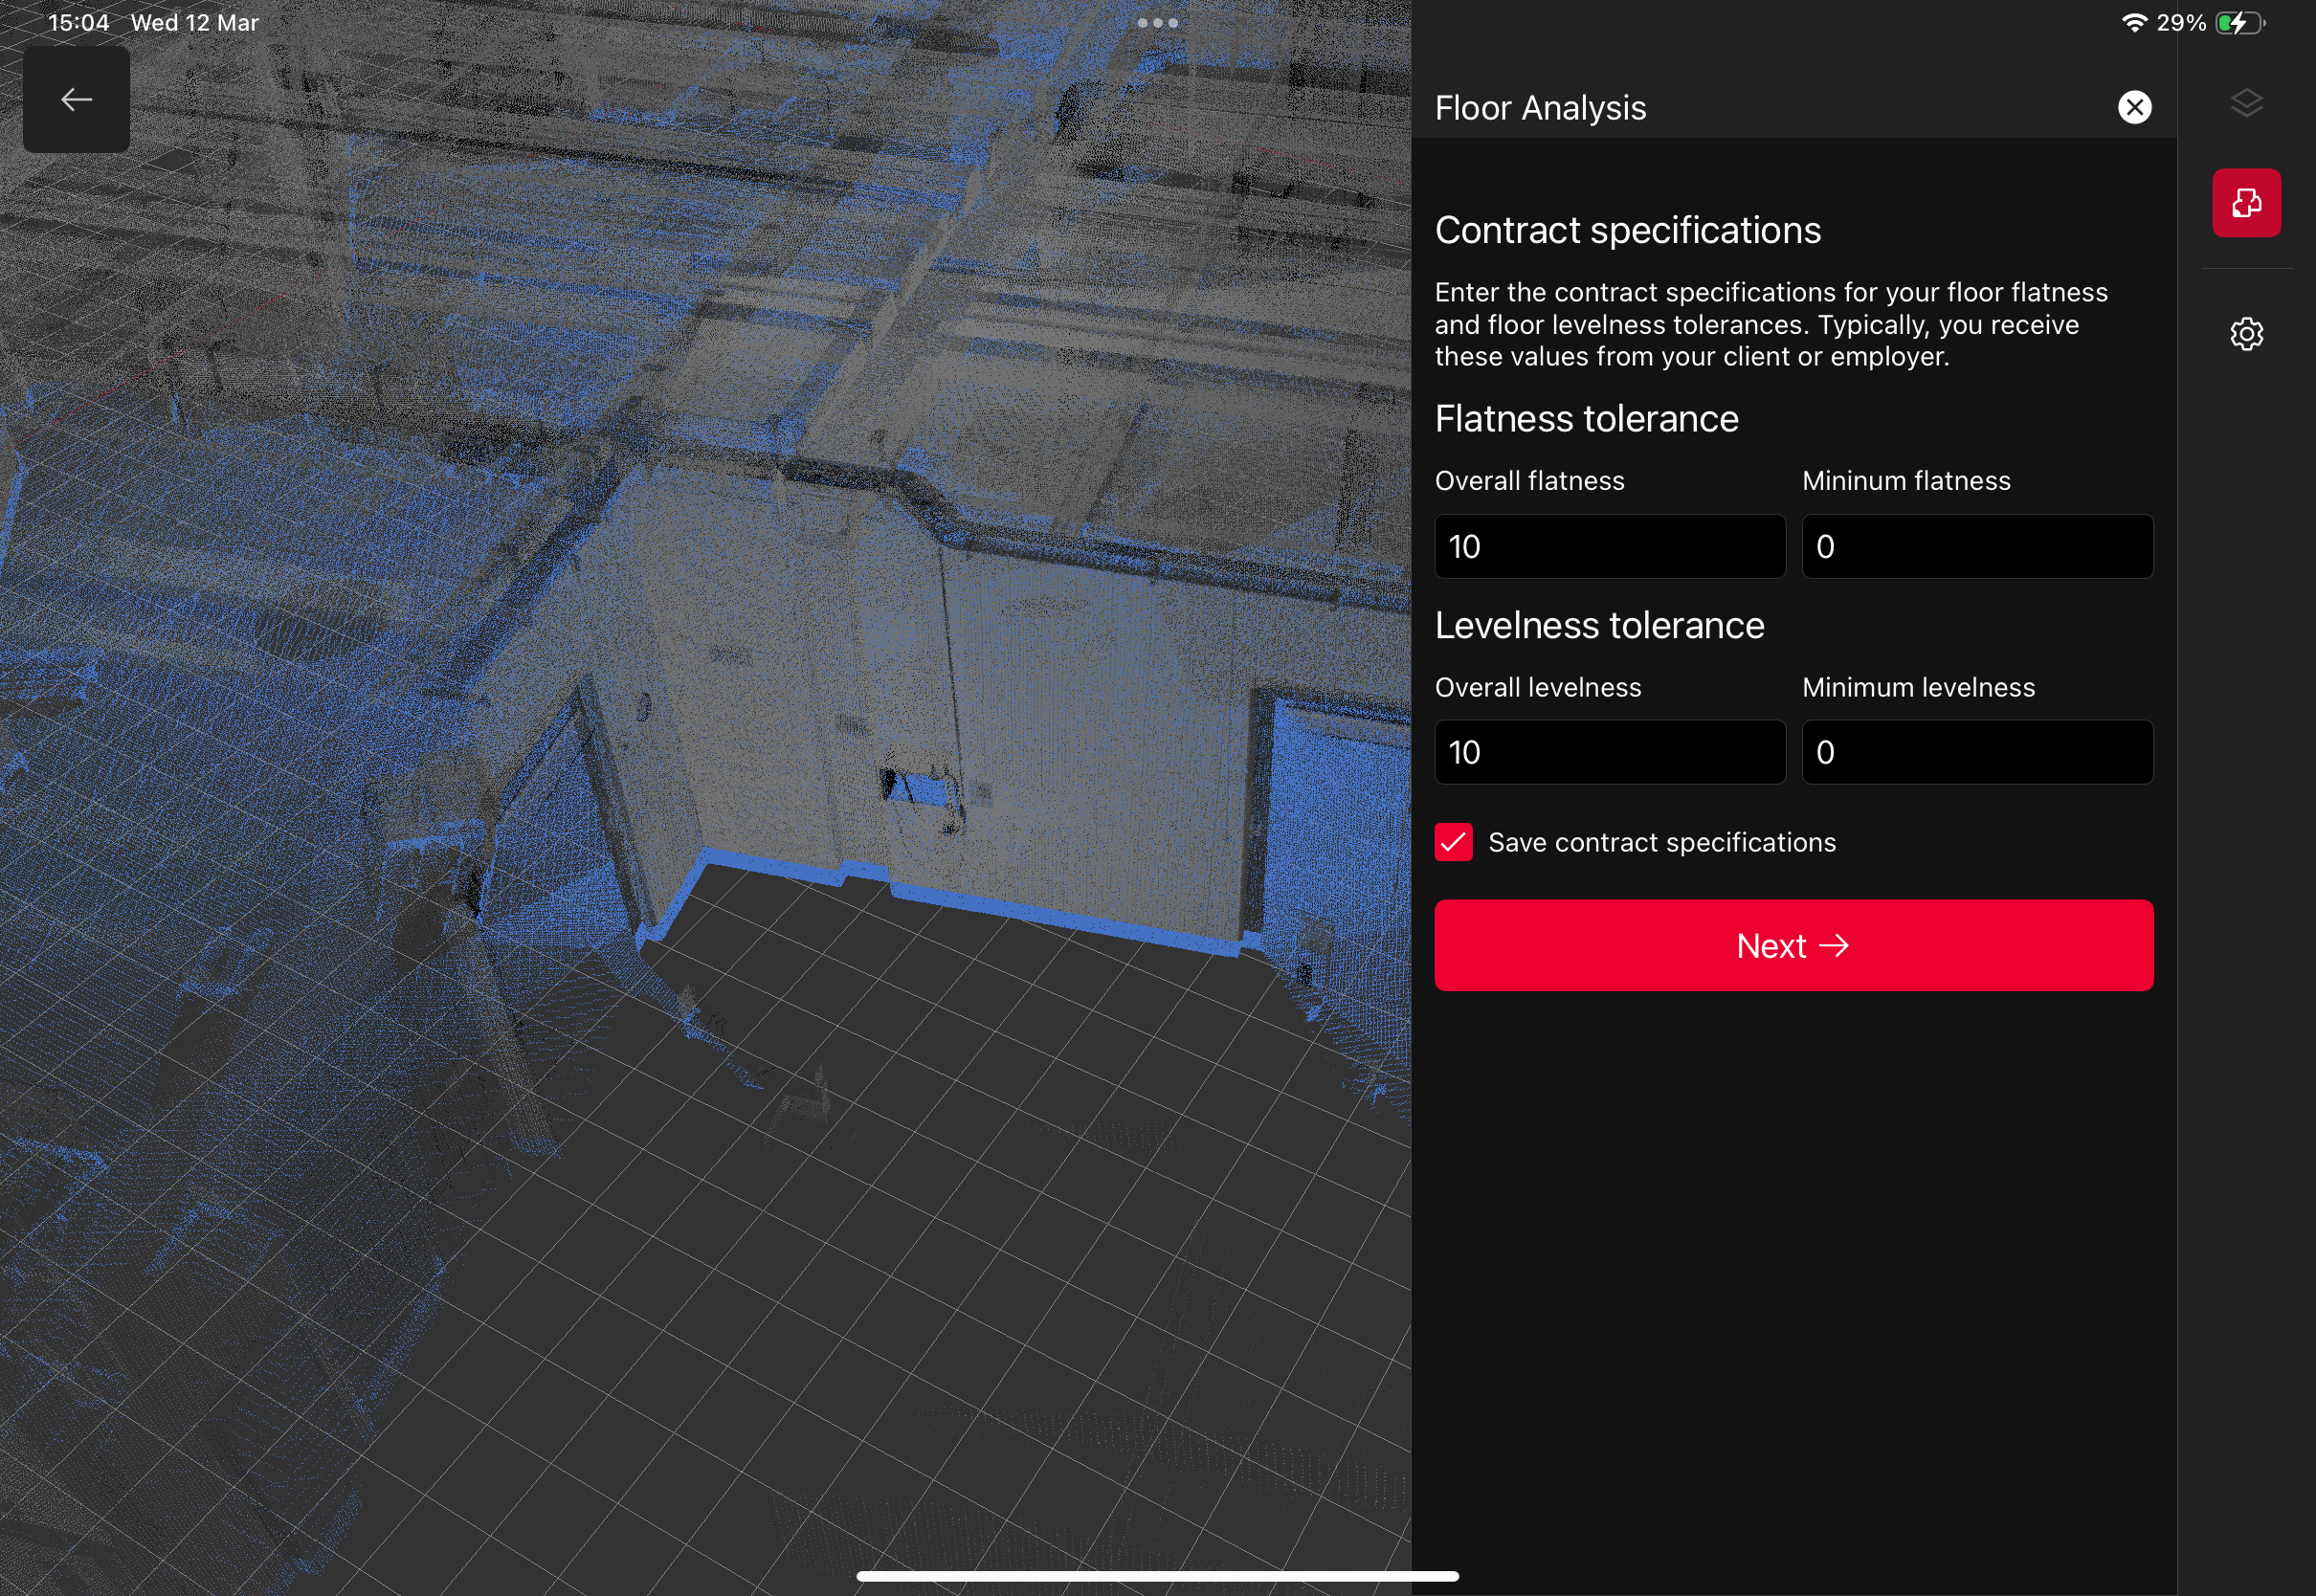
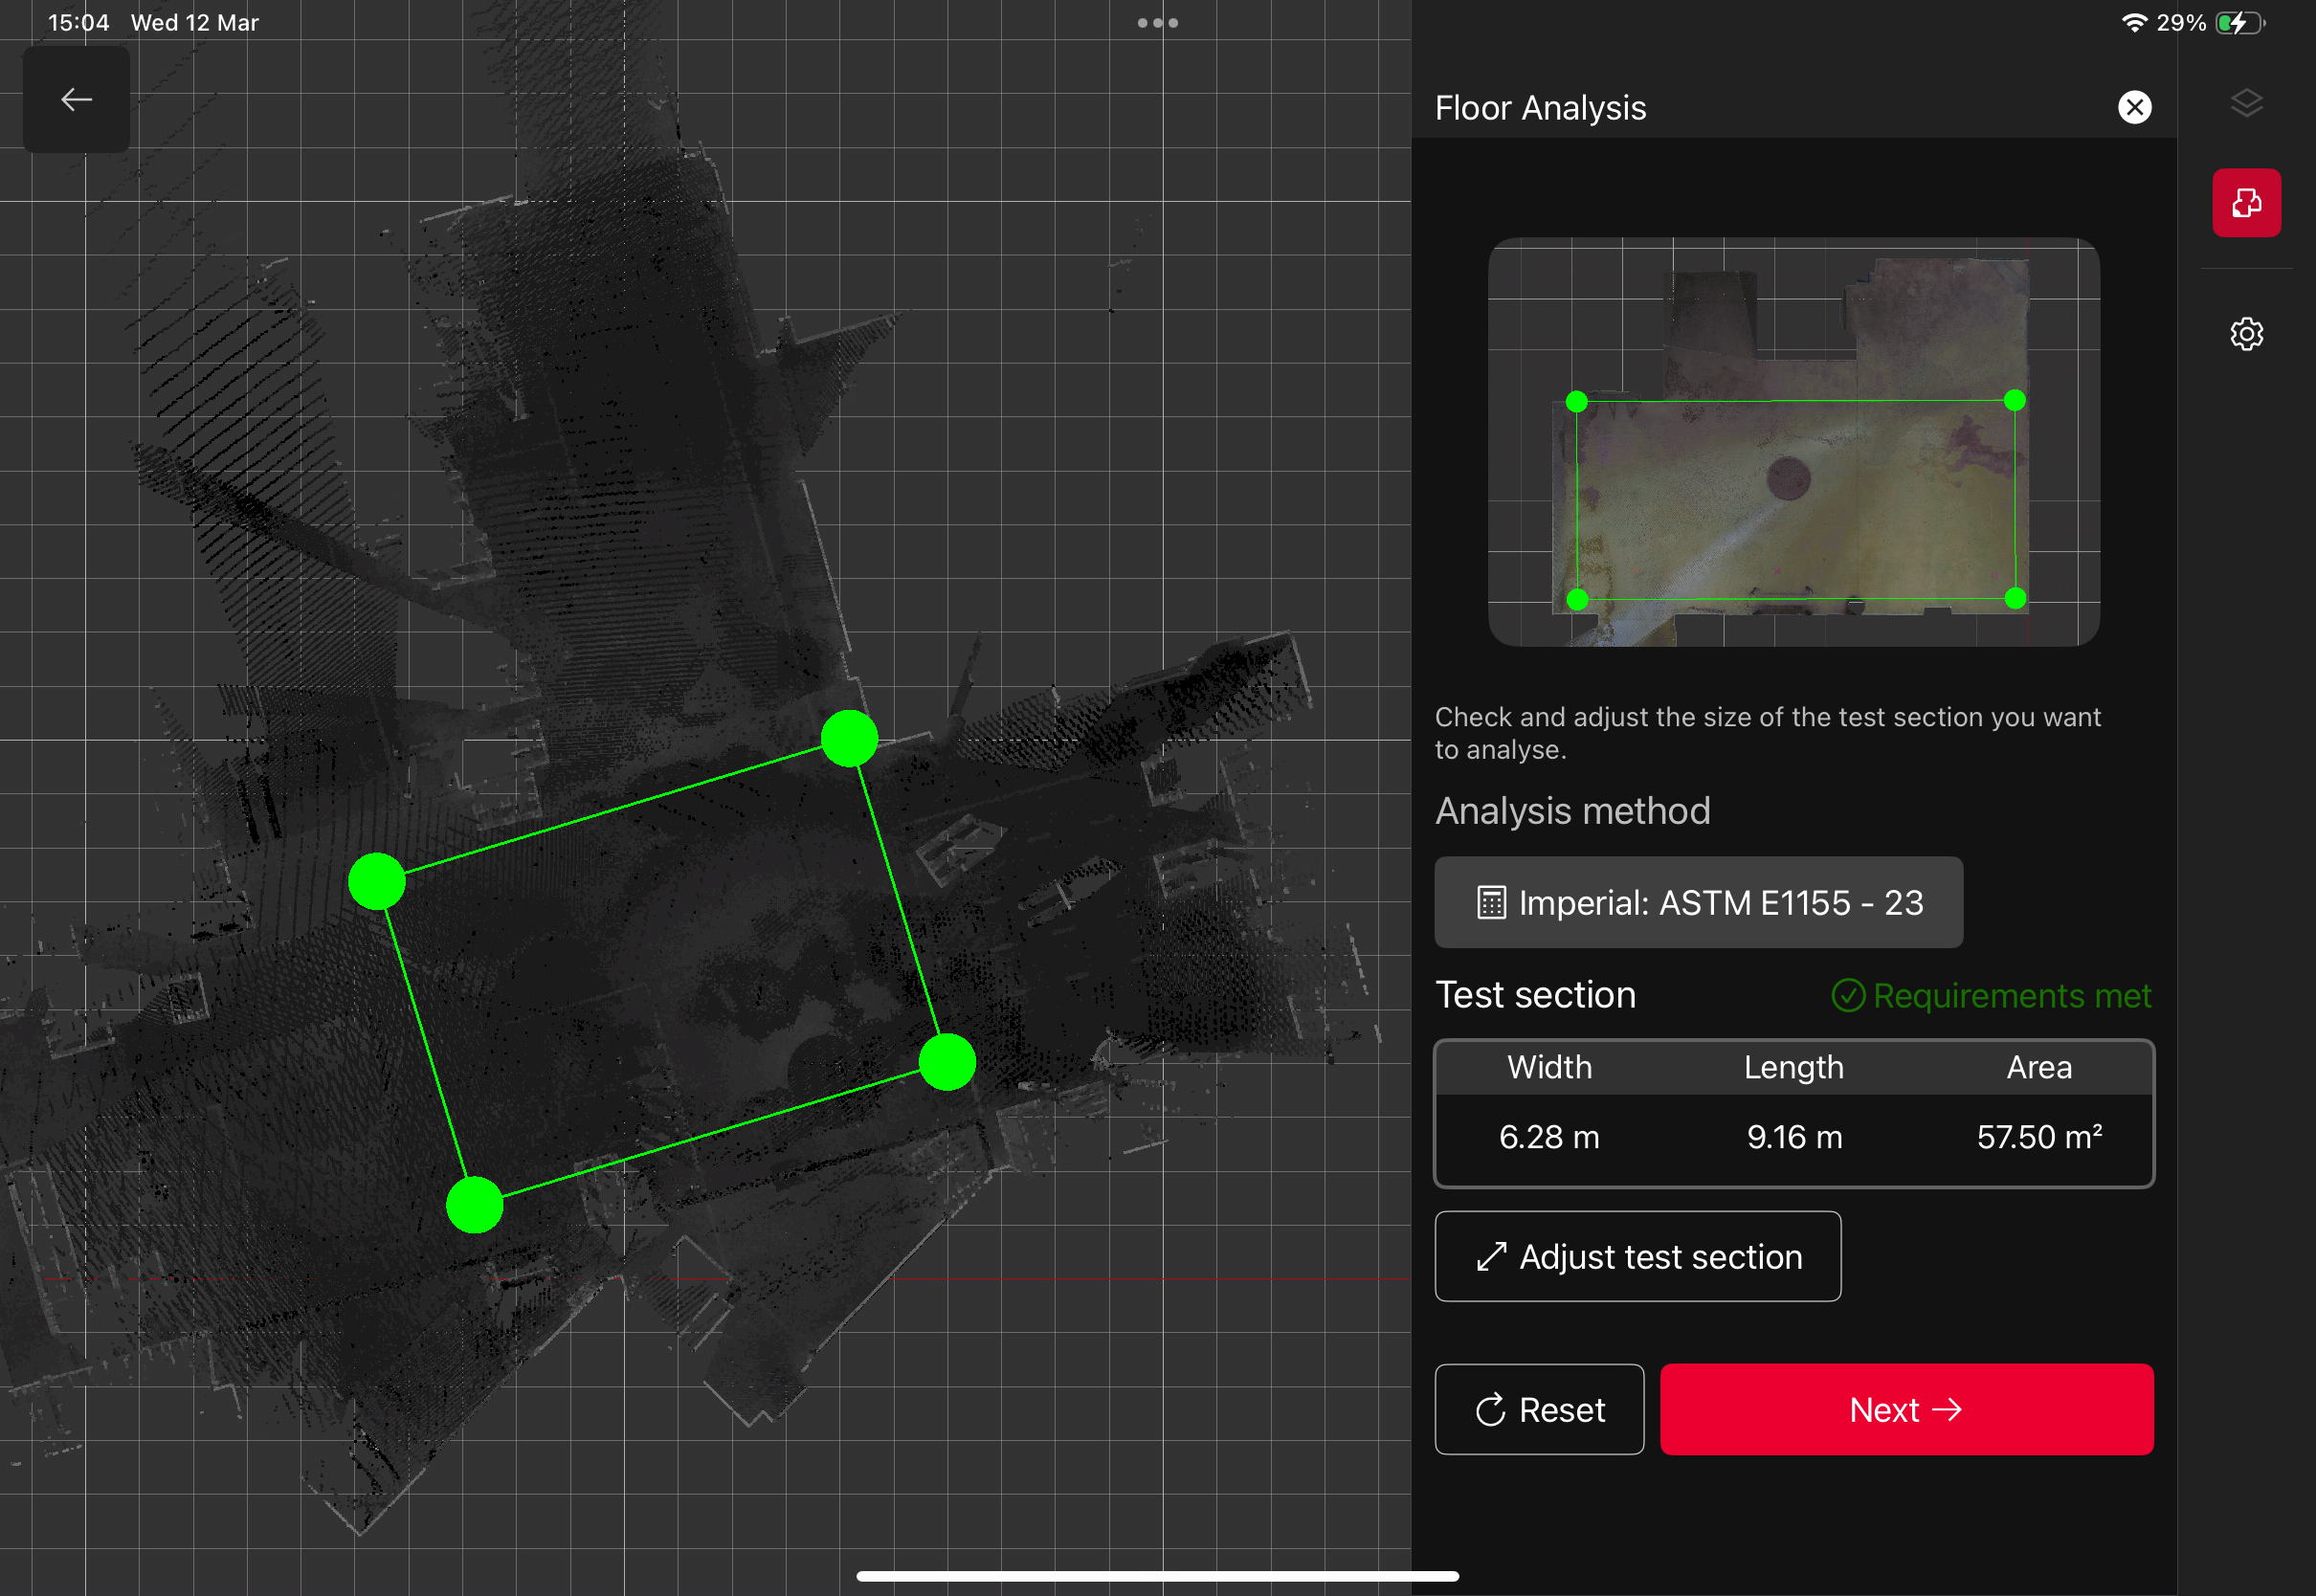
STEP 2 Define Test Section
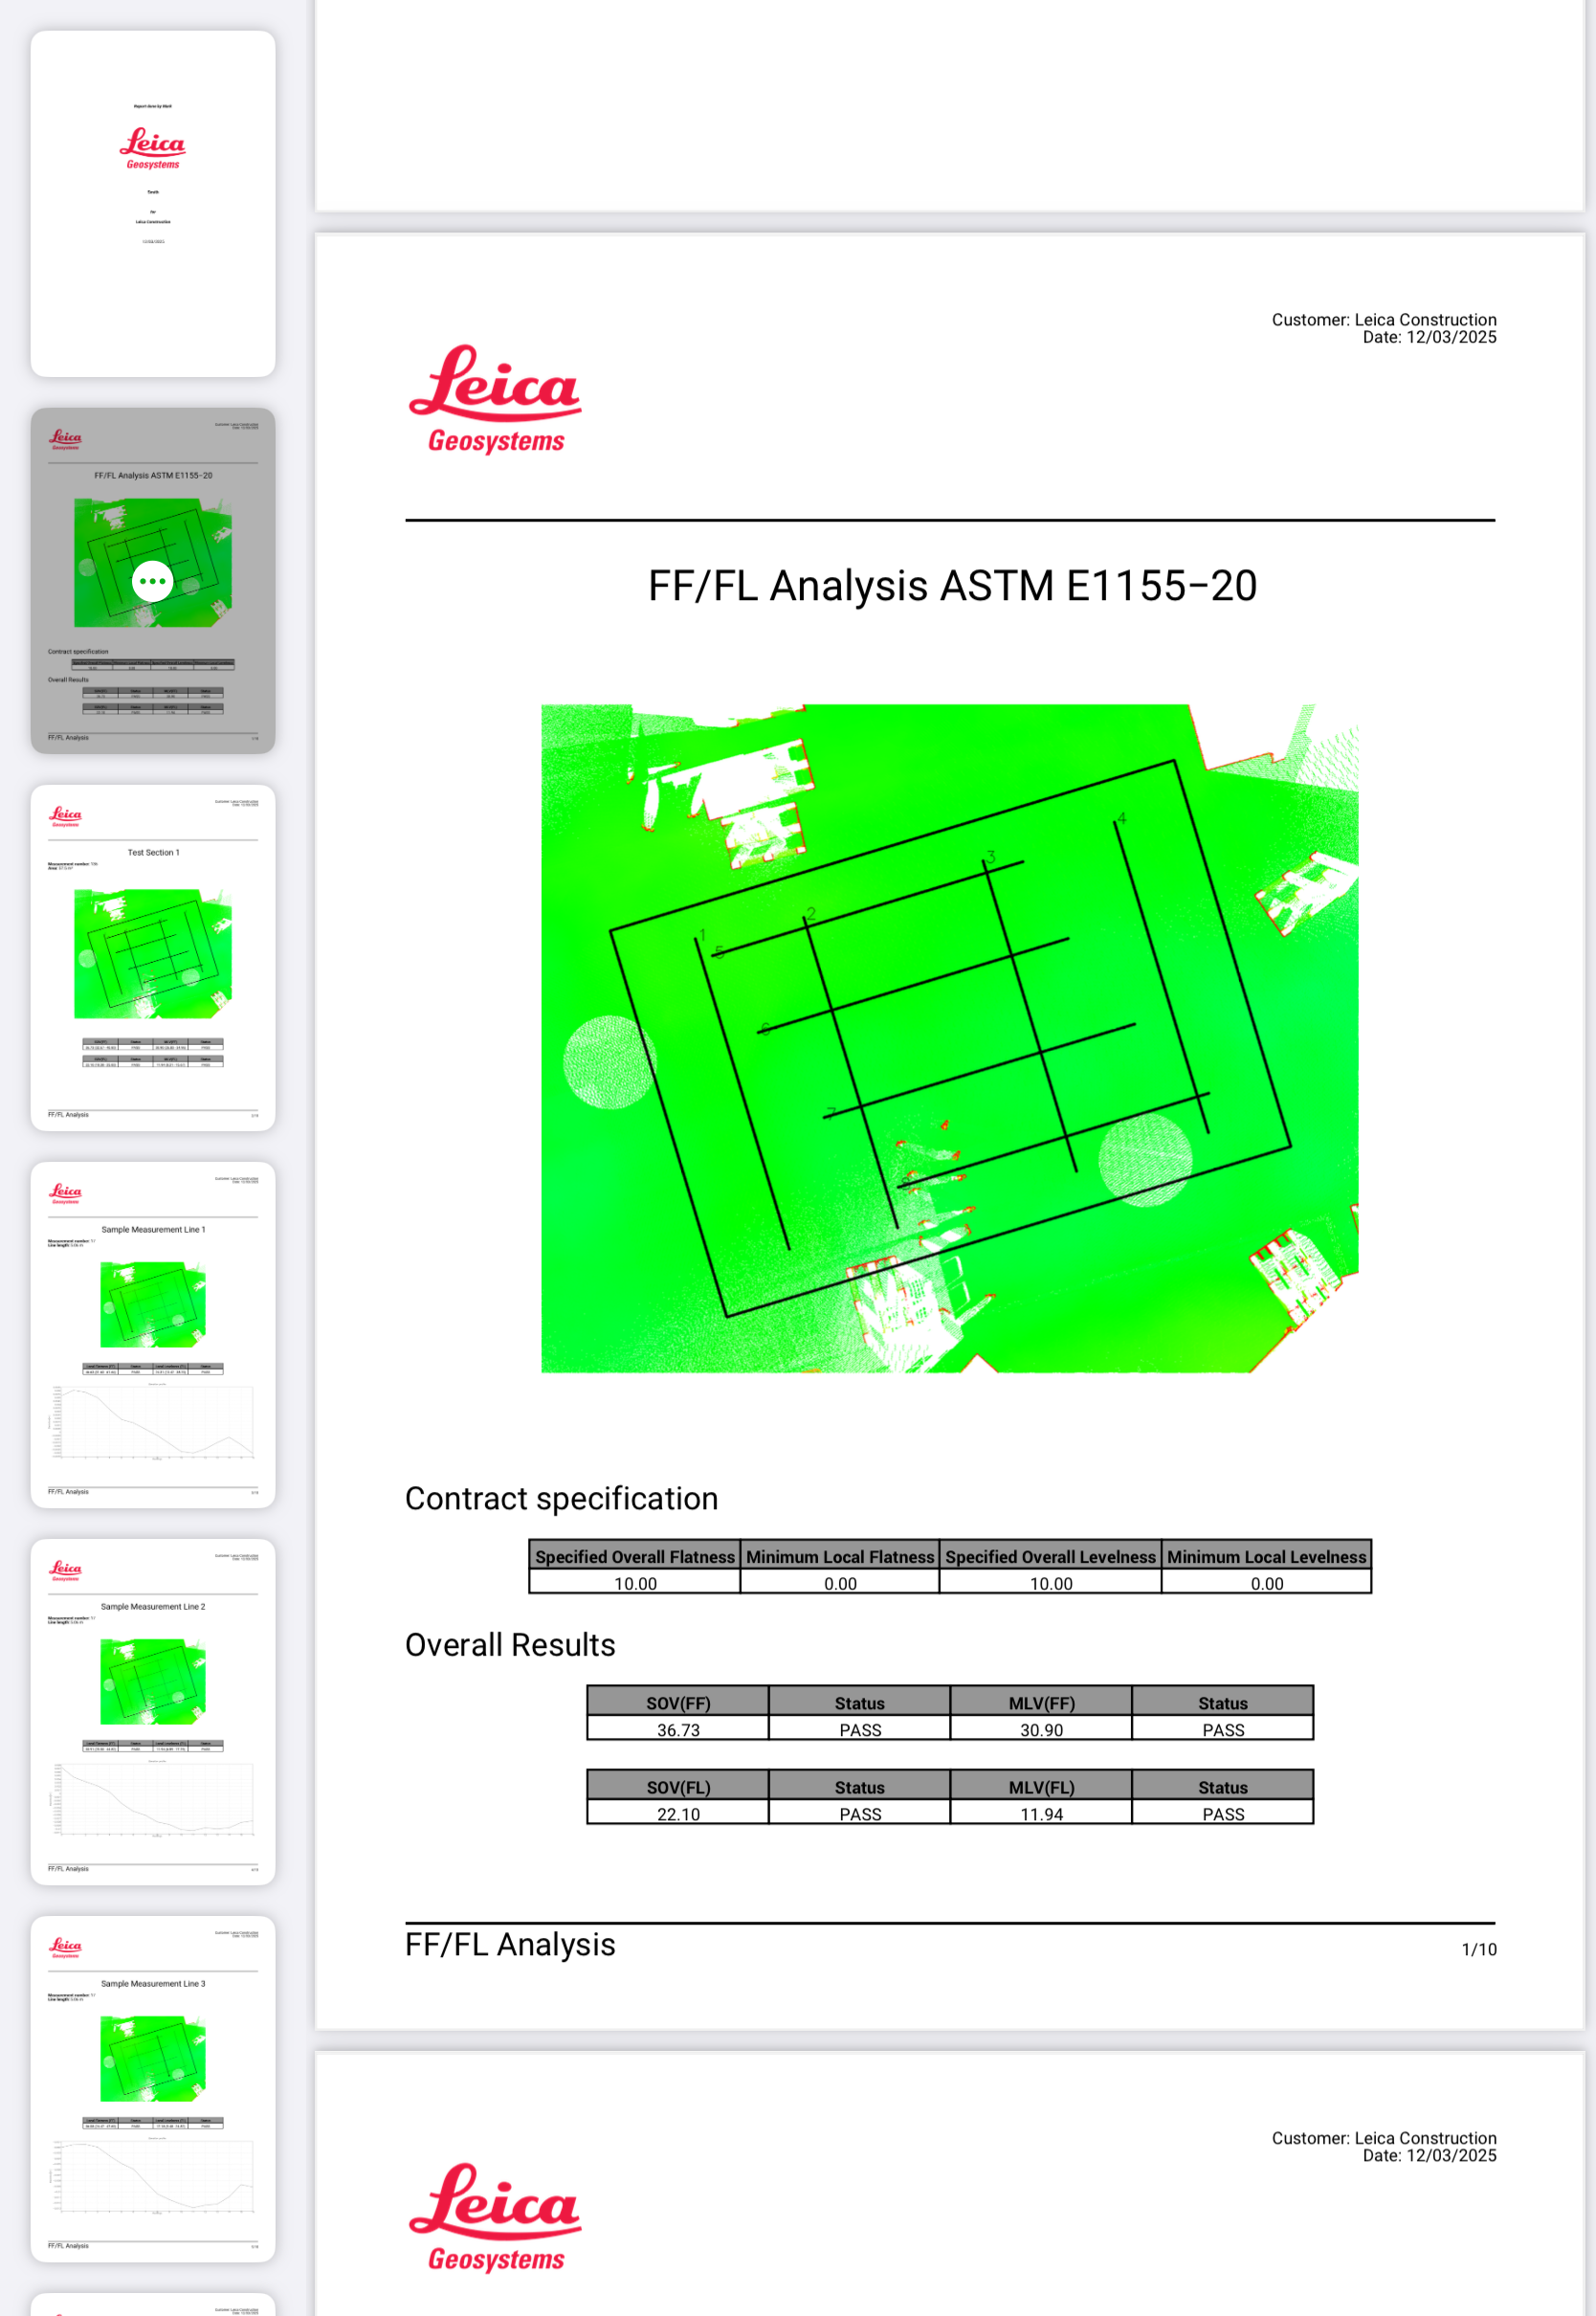
According to ASTM E1155 standard test section shoud satisfy the following criteria:
-
No test section shall measure less than 2.4 m [8 ft] on a side, nor comprise an area less than 30 m2 [320 ft2 ].
-
As a first step enter the contract specification values. Overall Flatness and Overall levelness are mandatory fields. Minimum flatness and minimum levelness values are the optional fields. Once the mandatory fields filled in, you can save the specifications and move on to the next step.
-
Next step is to define a test section, in this step you will have an option to switch point cloud colorization to Heat Map for better visibility, in case the point cloud has no RGB.
-
To pick a test section you need to select at least 3 points on the point cloud. Test section will turn green once the specification requirements are met ( test section must be at least 30m2 with shortest side measuring to at least 2.4m ) and you can save your test section and proceed to the next step – define sample lines, or reset and create a new test section.
-
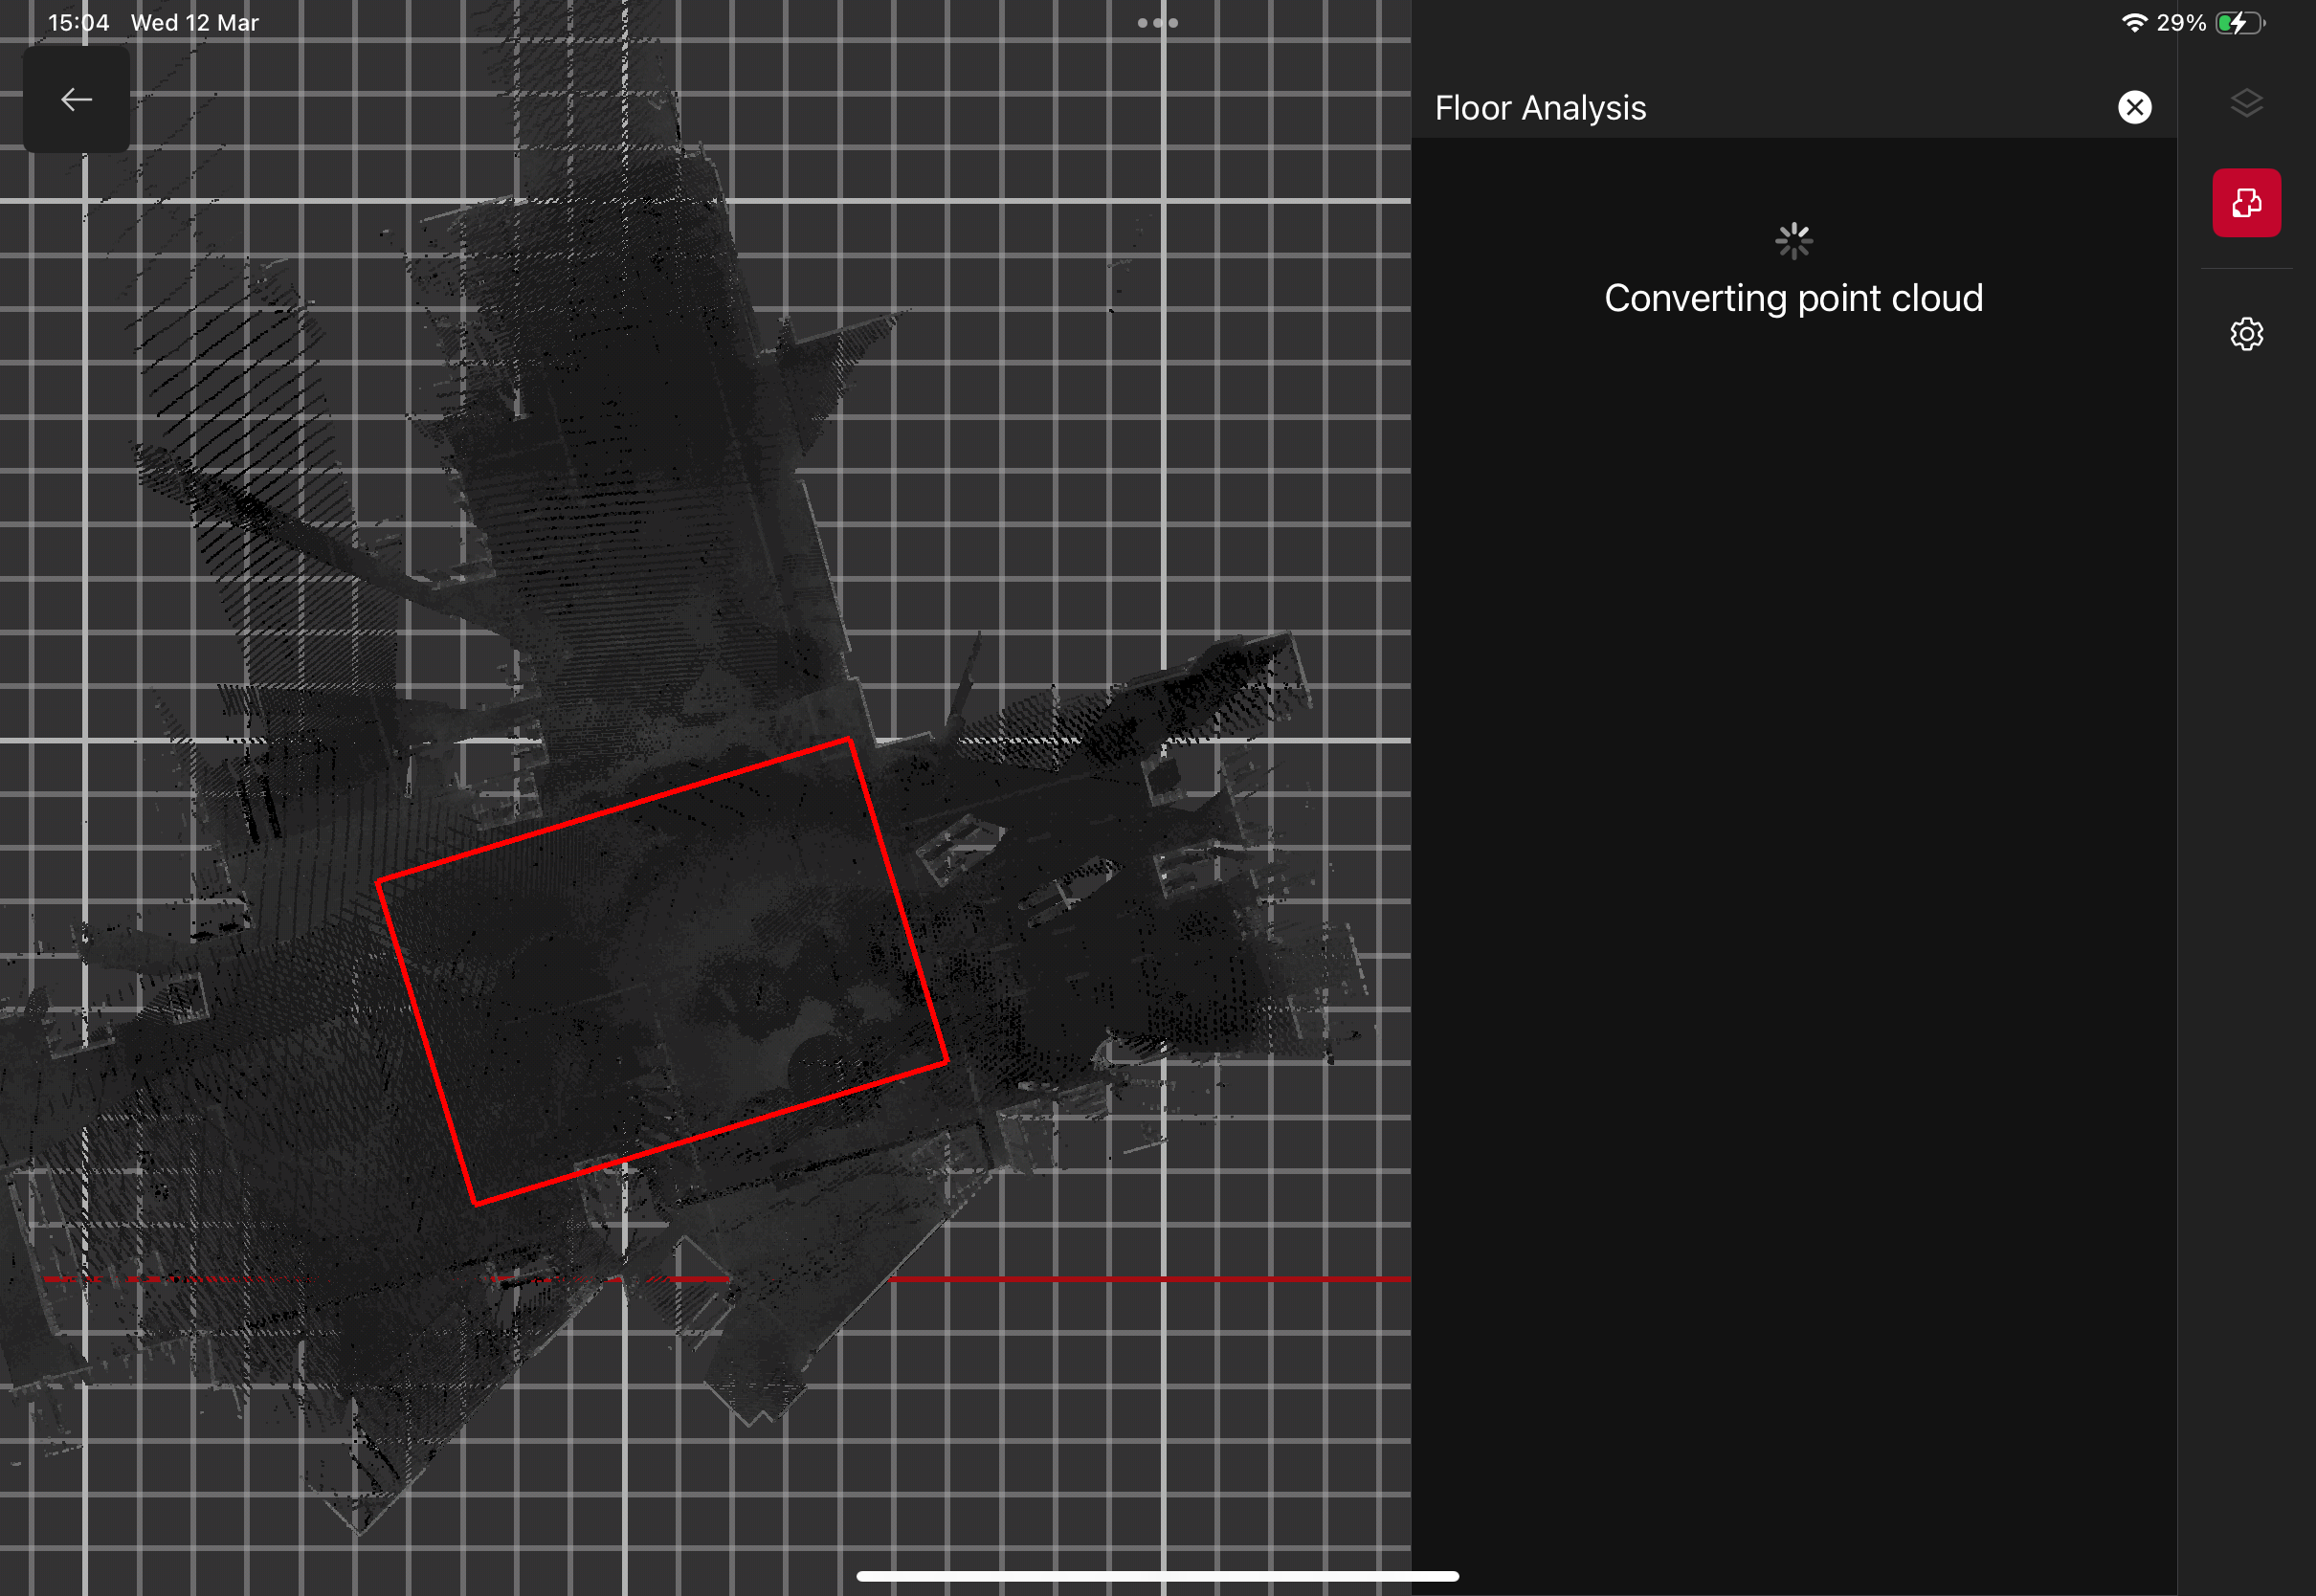
Once you committed to the next step – point cloud will be converted, please allow a few seconds for conversion.
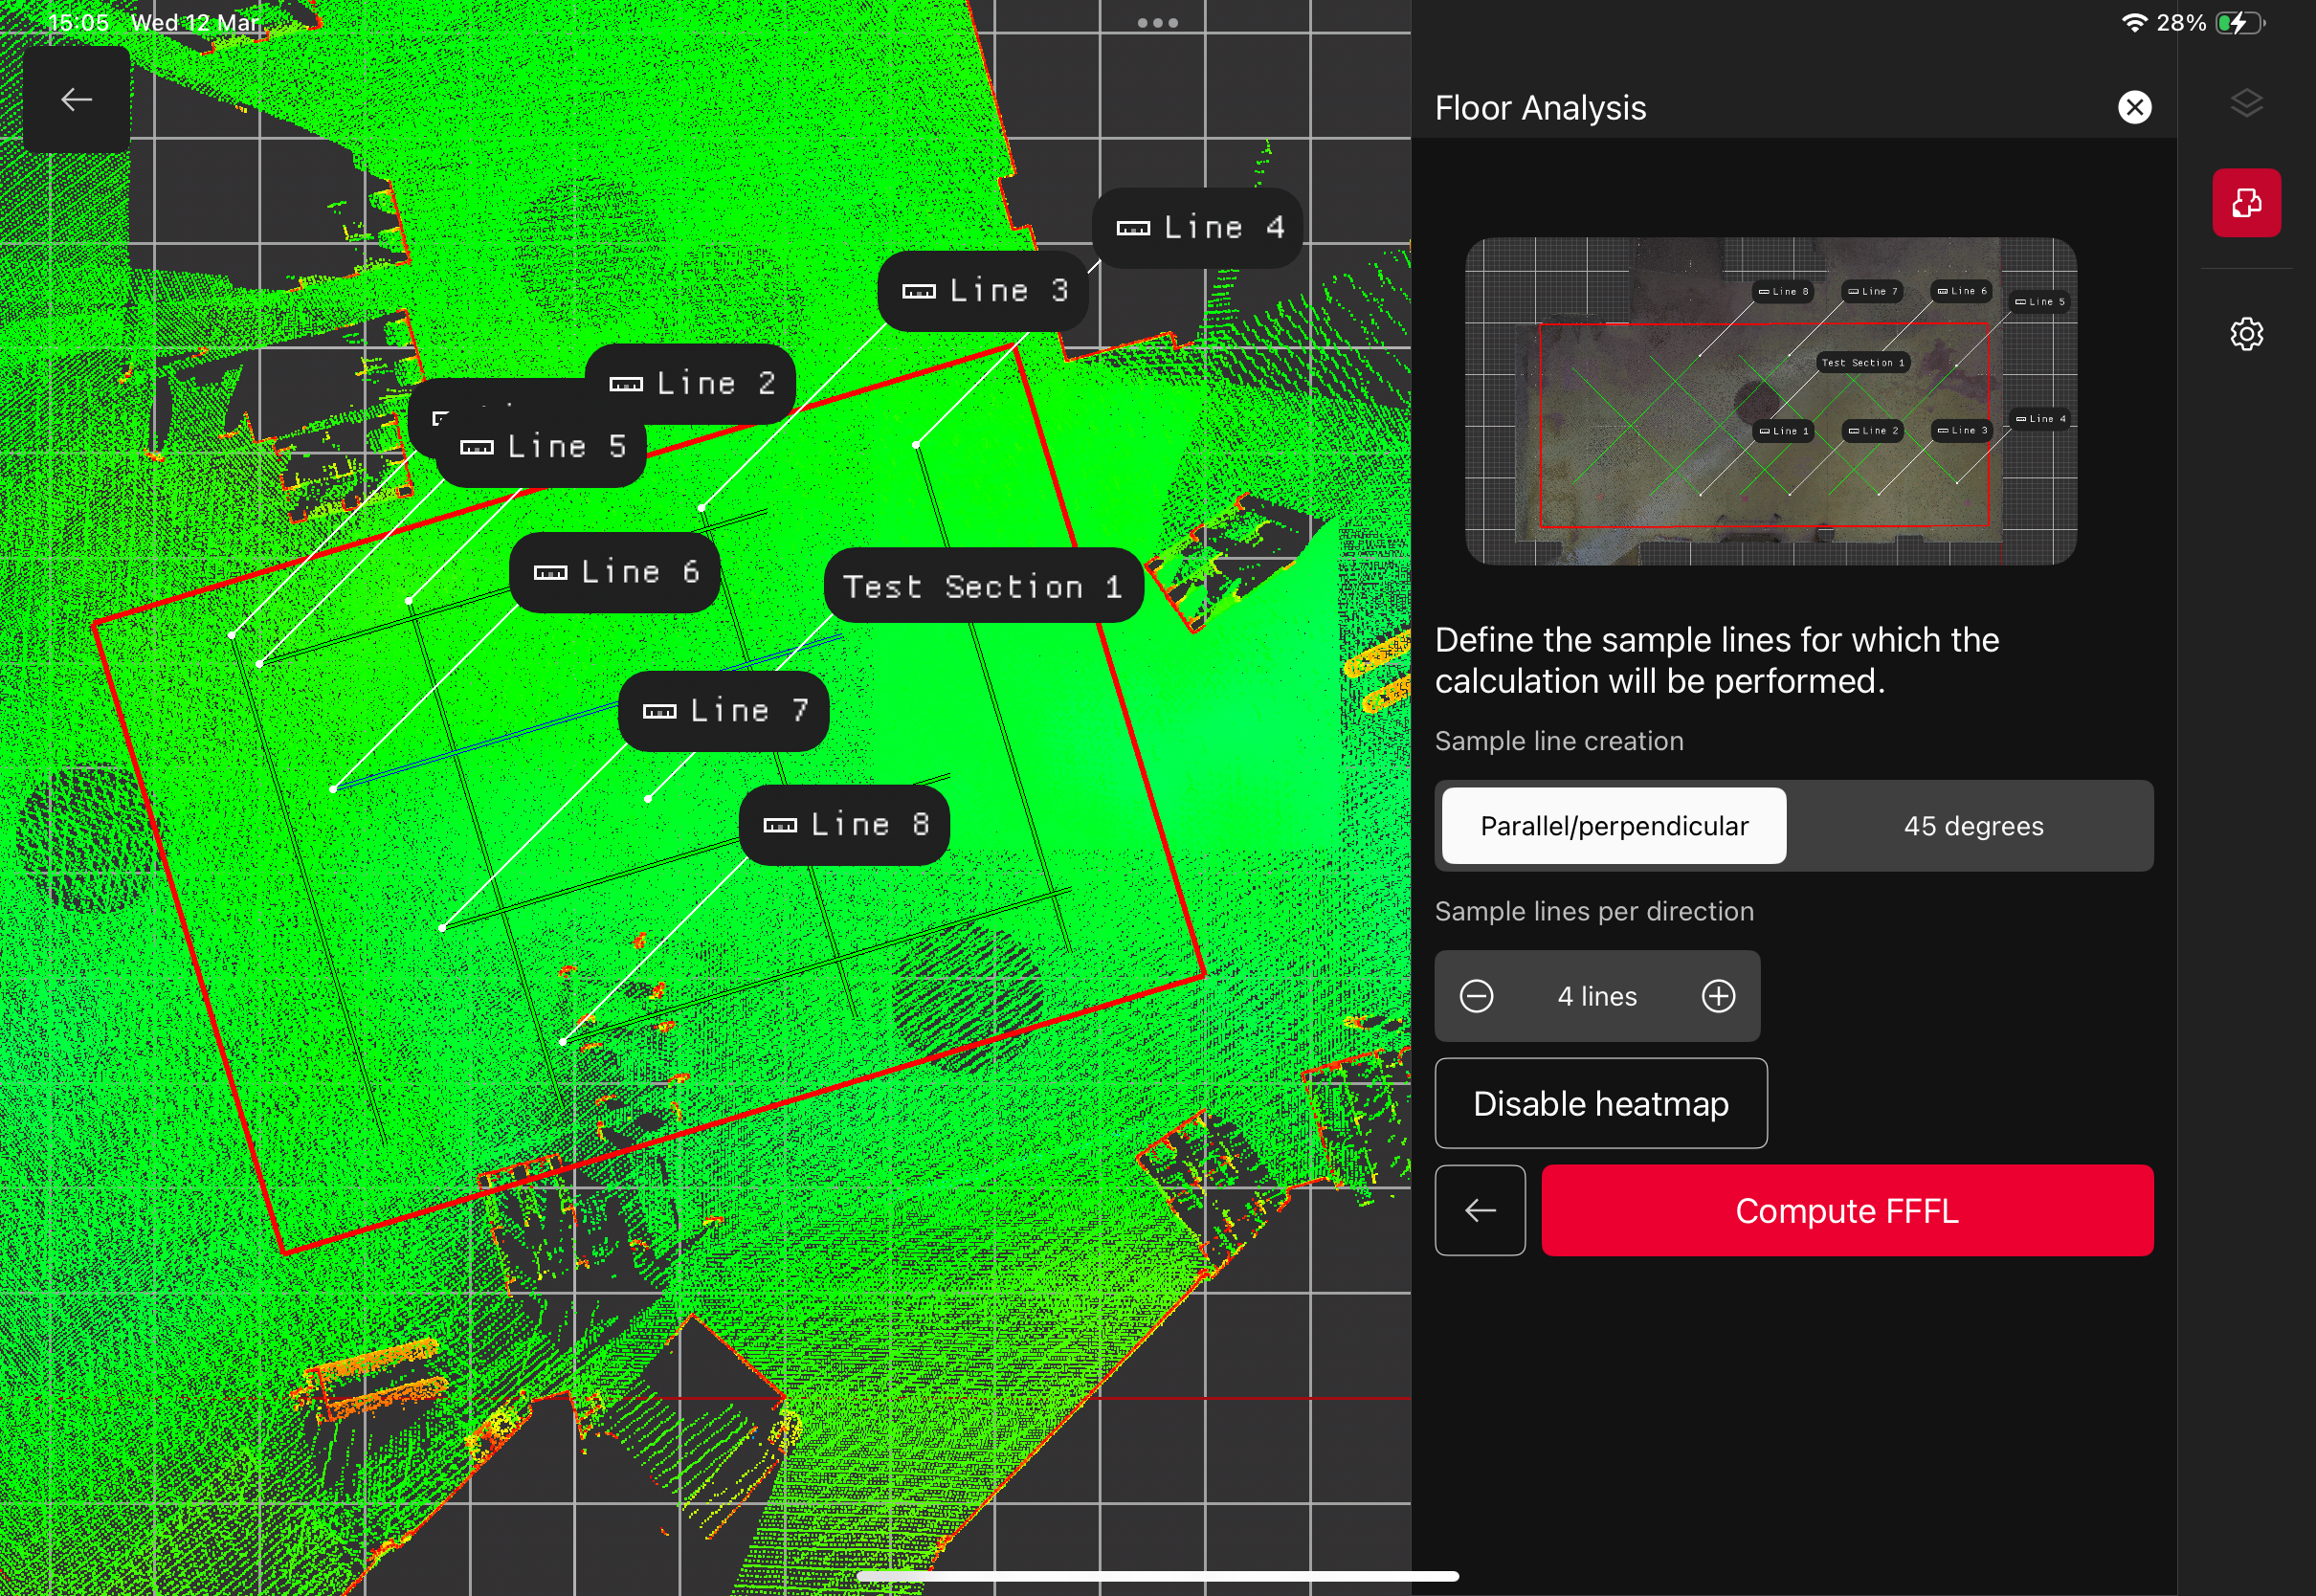
STEP 3 Define Sample Lines
A sample measurement line consist of any straight line on the test surface along which measurements are taken, with the limitations:
-
Measurement lines may not be placed parallel to each other closer than 1.2 m [4 ft].
-
A test sample shall consist of not less than twelve sequential point elevation measurements made at regular 300 mm [12 in.] intervals along a single sample measurement line.
-
Once you entered the sample lines section – the lines will be created automatically. You can change the creation method between the 2:
-
Parallel and Perpendicular. Minimum 4 lines will be created, user can change the number of lines and move the lines manually if needed to avoid gaps or unwanted areas.
-
45 degrees. Minimum 4 lines will be created, user can change the number of lines and move the lines manually if needed to avoid some areas, it is also possible to revert direction
-
Once you are happy with the sample lines press Compute FFFL to continue
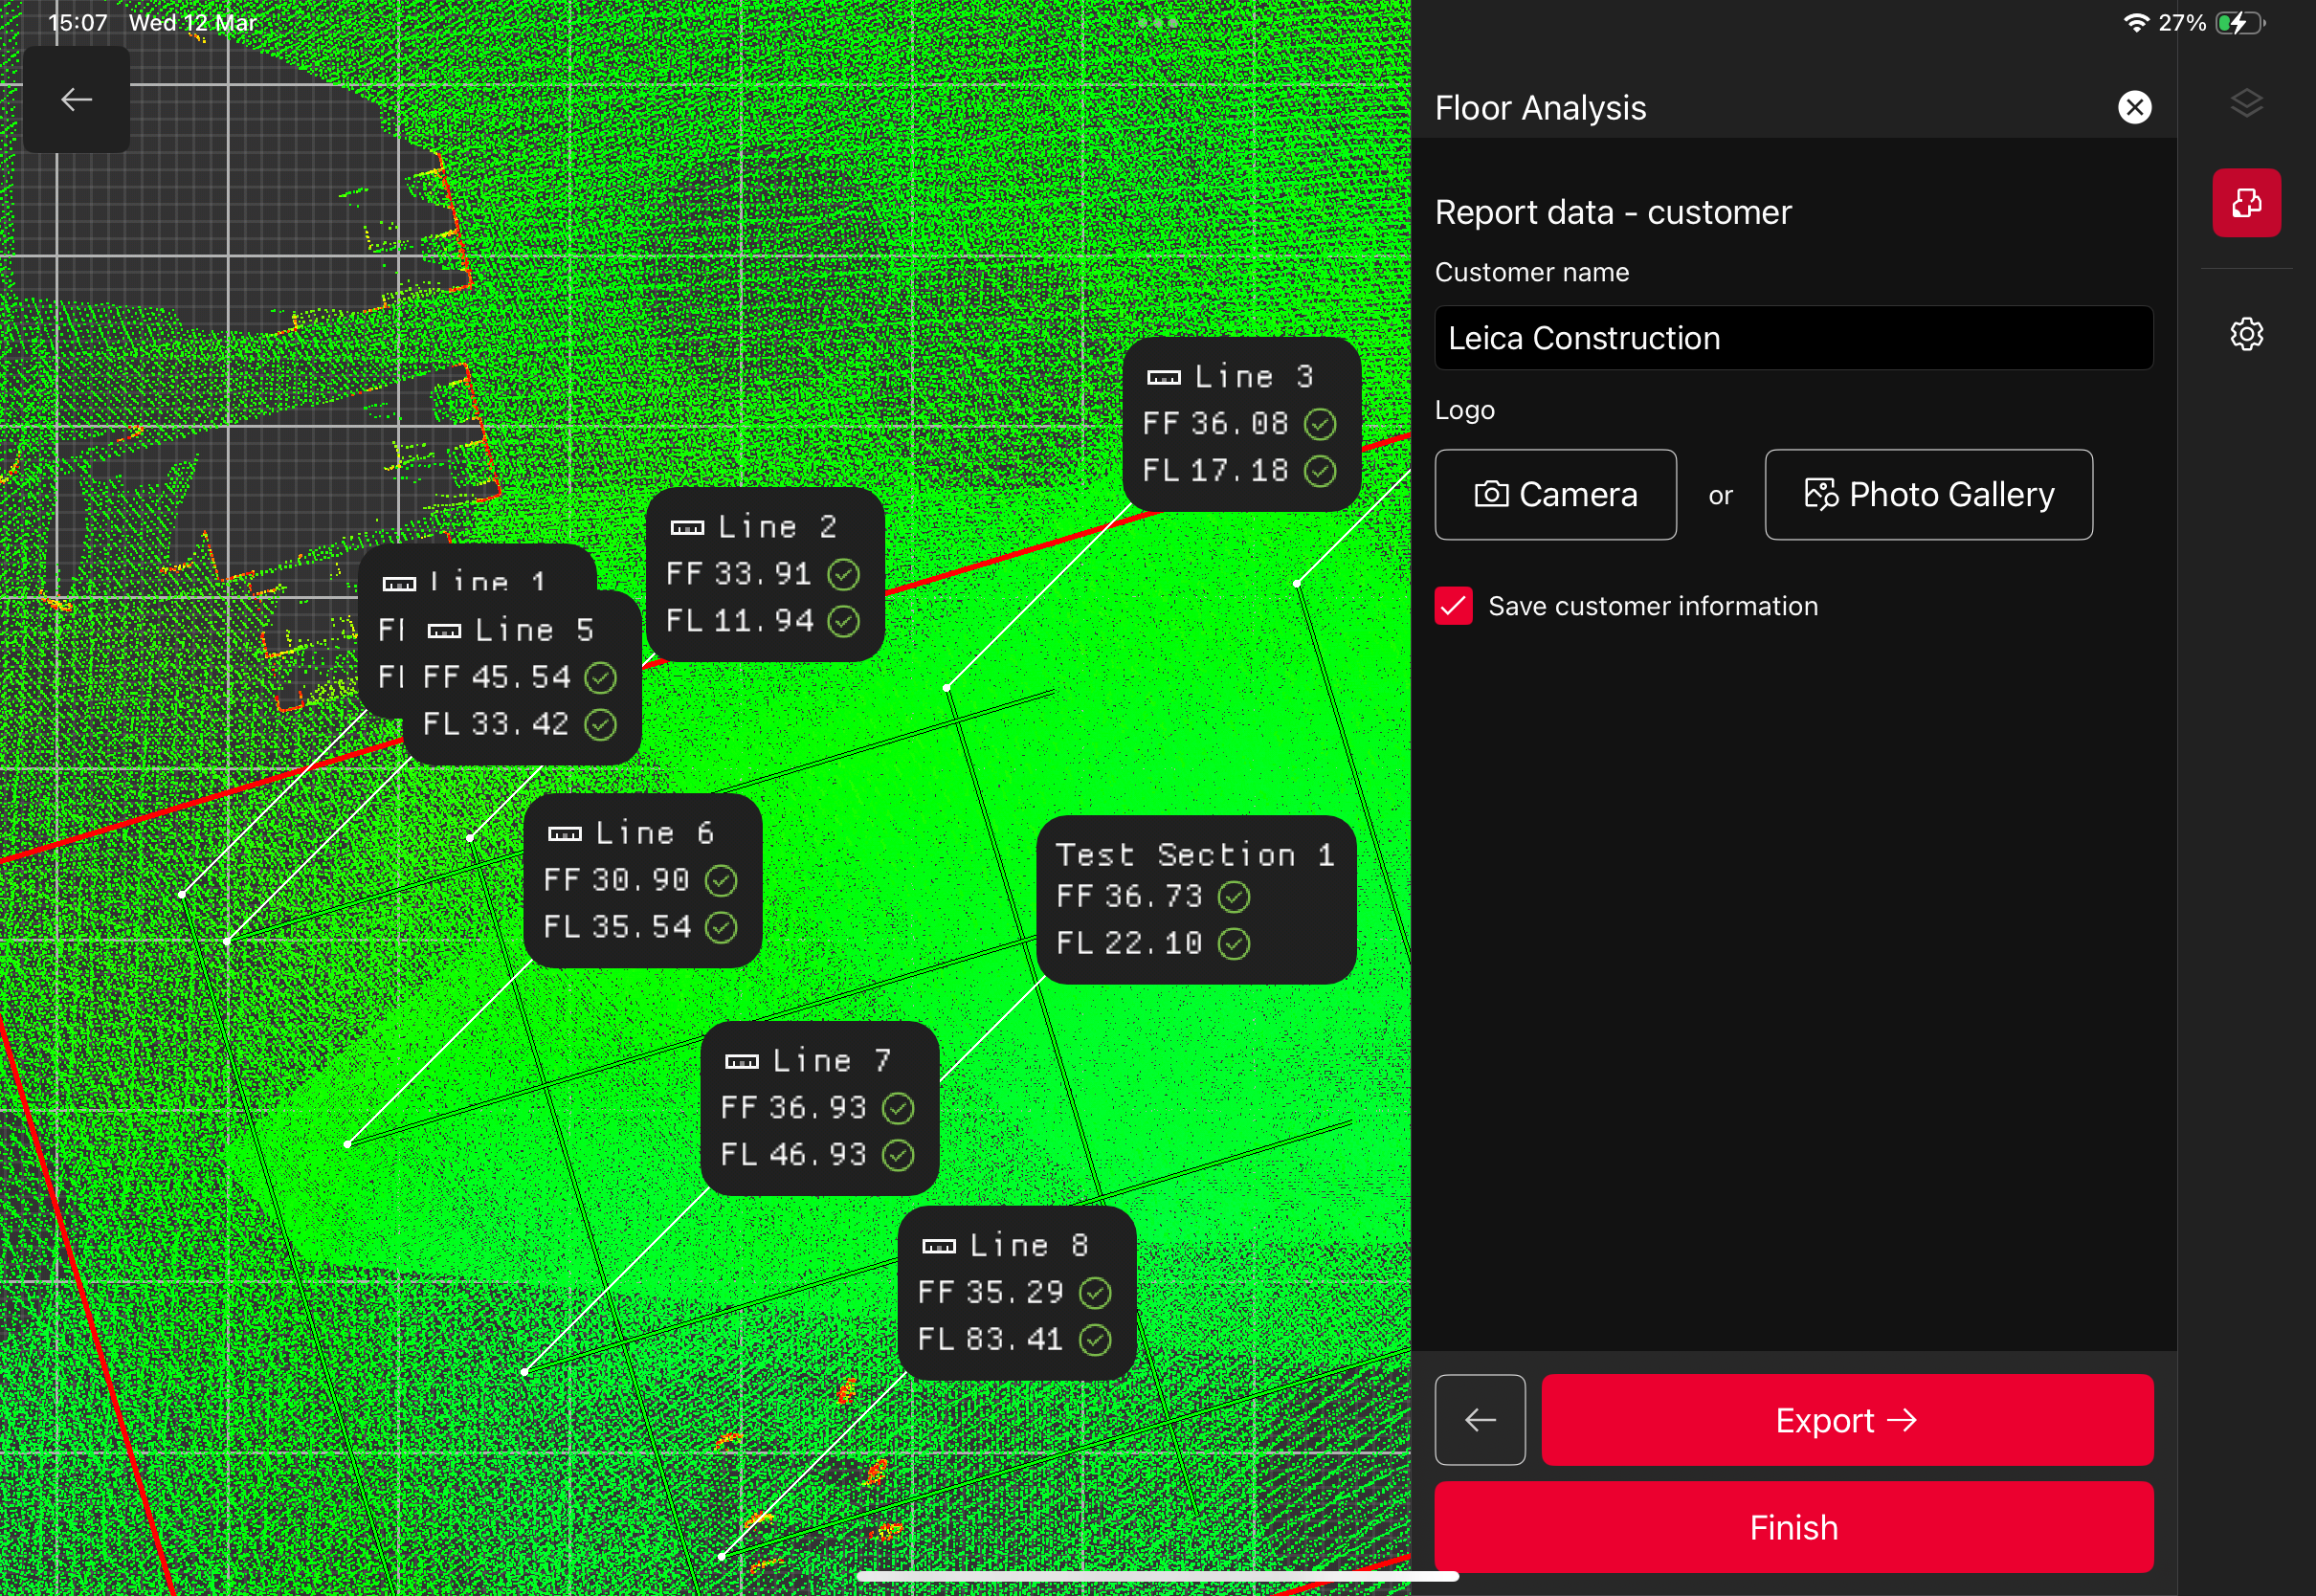
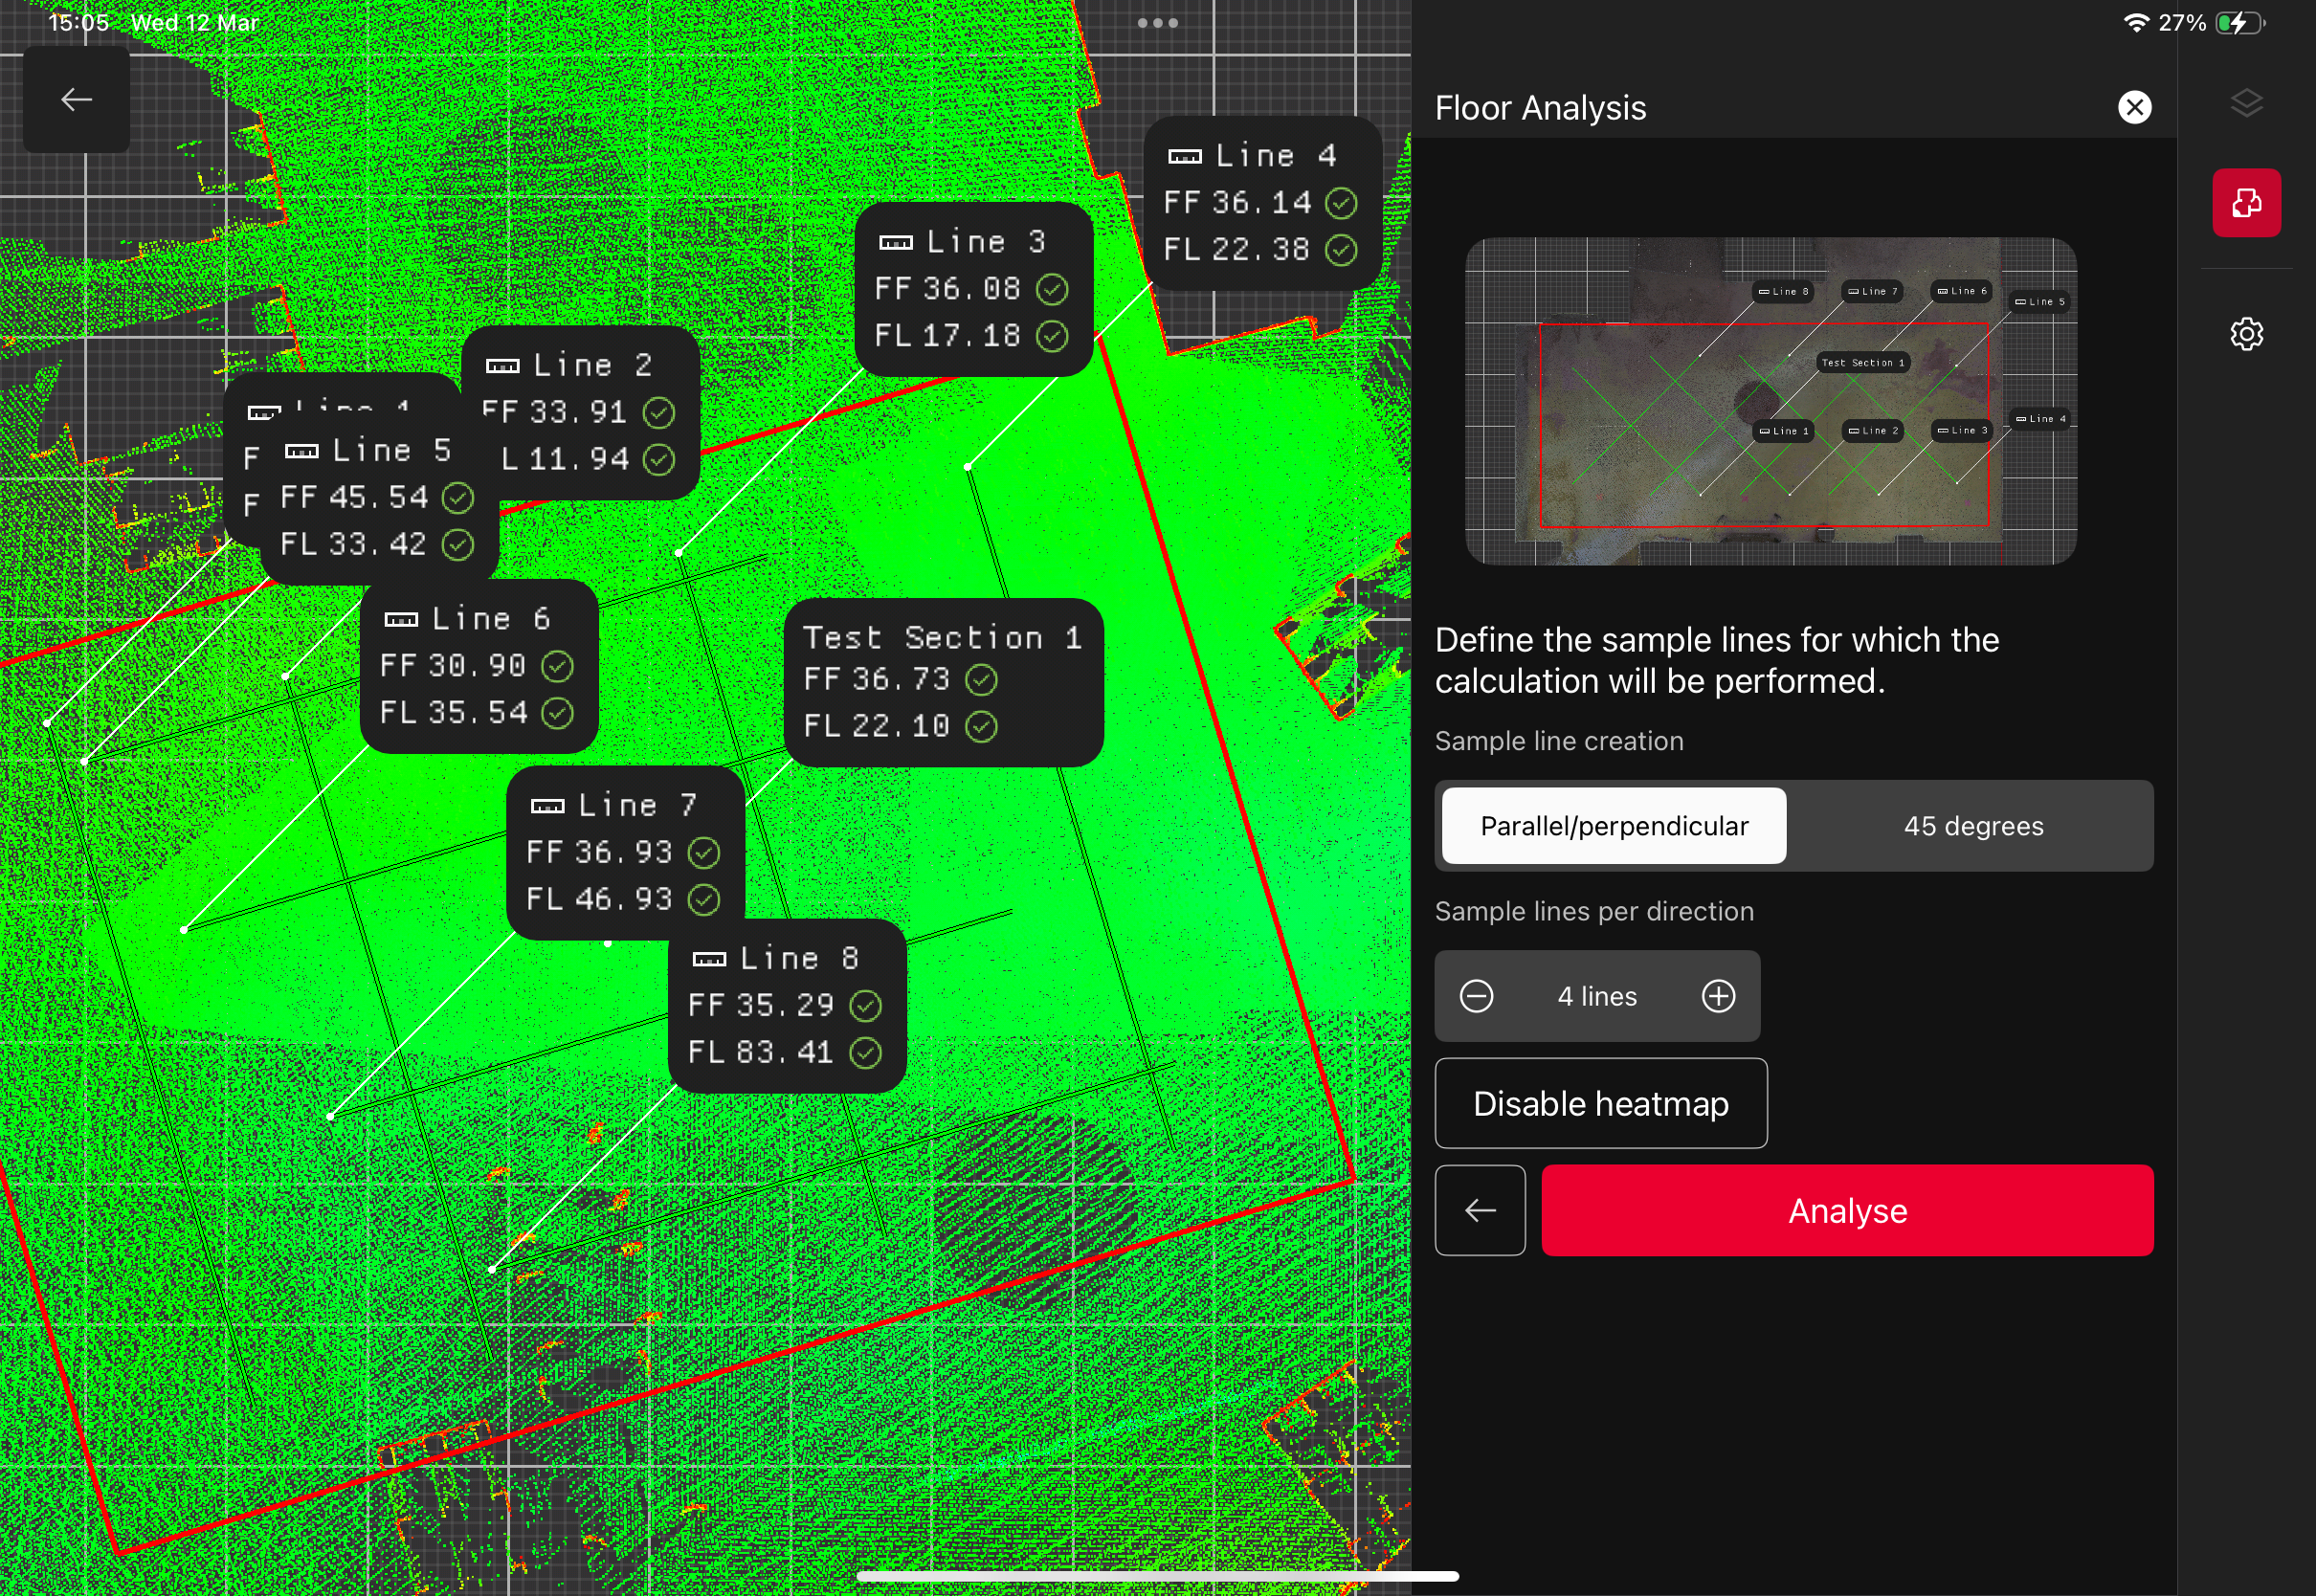
STEP 4 Check Flatness and Levelness Results
At this stage FIELD 3600 app will display the analysis results. FFFL results for each line and overall test section results. If acceptable, proceed to the report generation step, by tapping the Analyse button on the screen.
STEP 5 Generate Report
Report is customizable.
It is possible to input Company name and logo and also Customer name.
Report can be exported as PDF and saved on a mobile device
Press Finish to complete the analysis workflow.
Note:
Once the Finish button pressed, all previous FFFL calculations will be removed. You need to follow the workflow once again from the beginning if need to adjust